30 April 2007

Primary and secondary school attendance in Nepal

Nepal is a country with historically large gender disparities in school attendance, where girls were much less likely than boys to receive a formal education. Since the 1980s the country has made remarkable progress toward gender parity in the education system so that the Millennium Development Goal of gender parity in primary and secondary education appears to be within reach. The trends in primary school attendance are discussed in detail in the article "Nepal: trends in primary education, 1980-2004" that was posted on this site in March 2007.

The present article takes a closer look at primary and secondary school attendance rates in Nepal. The data was collected in a Demographic and Health Survey (DHS) in 2001. DHS surveys are nationally representative household surveys that are carried out with support from the U.S. Agency for International Development. With the DHS data it is possible to examine disparities in the education system that go beyond gender.

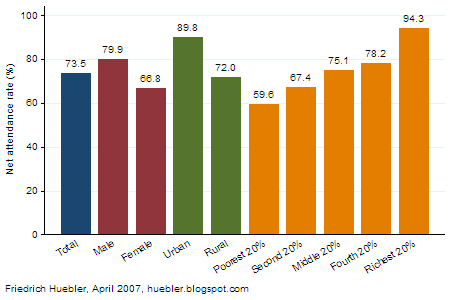
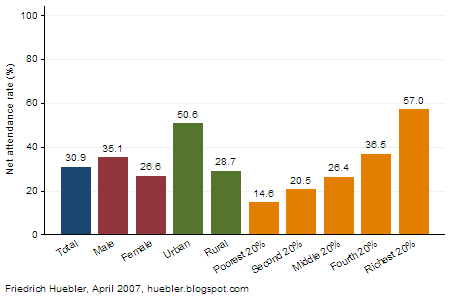
In Nepal, the official primary school age is 5 to 9 years. The official secondary school age is 10 to 16 years. The primary school net attendance rate (NAR) in 2001 is shown in Figure 1 and the secondary school NAR in Figure 2.

Overall, 73.5 percent of all children of primary school age were attending primary school. In spite of the progress toward gender parity over the past two decades, girls still attend primary school to a lesser degree than boys. The primary NAR of girls is 66.8 percent, compared to 79.9 percent for boys. However, other disparities in school attendance are larger than the male-female disparity. In rural areas, 72.0 percent of children of primary school age are in school, compared to 89.8 percent in urban areas. The biggest disparities are linked to household wealth. In the richest 20 percent of all household in Nepal, the primary NAR is 94.3 percent. As household wealth declines, the primary NAR also falls and among children from the poorest 20 percent of all households, the primary NAR is only 59.6 percent.

Figure 1: Primary school attendance in Nepal
Bar graph showing primary school net attendance rate in Nepal
Source: Nepal 2001 Demographic and Health Survey (DHS).

Less than half of all Nepali children continue their education at the secondary level. In the country as a whole, 30.9 percent of all children of secondary school age attend secondary school. Among boys, the secondary NAR is 35.1 percent, compared to 26.6 percent among girls. As at the primary level, the disparities linked to the area of residence and to household wealth are larger than the disparities linked to gender. In urban areas, the secondary NAR is 50.6 percent and in rural areas it is 28.7 percent. One likely explanation for this difference is the scarcity of secondary schools in rural Nepal. The link between poverty and school attendance at the secondary level of the education system is even stronger than at the primary level. For children from the richest 20 percent of all households, the secondary NAR is 57.0 percent. Among the poorest 20 percent of all households the secondary NAR is 14.6 percent, less than a quarter of the NAR in the richest households.

Figure 2: Secondary school attendance in Nepal
Bar graph showing secondary school net attendance rate in Nepal
Source: Nepal 2001 Demographic and Health Survey (DHS).

In conclusion, whereas Nepal has been able to move towards gender disparity in its education system, children from rural areas and from poorer households continue to be at a great disadvantage.

Note: In this article, the primary school NAR is defined as the share of children of primary school age who are attending primary or secondary school. Attendance at the secondary level is included because children of primary school age in secondary school would otherwise be counted as out of school. Similarly, the secondary school NAR counts children of secondary school age in secondary or higher education as attending secondary school.

Related articles
External links
Friedrich Huebler, 30 April 2007 (edited 12 October 2008), Creative Commons License
Permanent URL: http://huebler.blogspot.com/2007/04/primary-and-secondary-school-attendance.html

01 April 2007

Updates to two Stata guides

Two Stata guides on this site have been updated. The guide to creating maps with Stata now covers the recently released module spmap by Maurizio Pisati, an update to his tmap module. Both spmap and tmap are free add-ons for the Stata statistical package. The guide to creating PNG images with Stata was also revised.

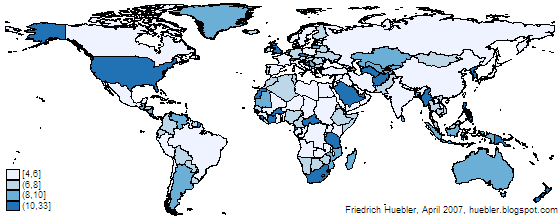
Map created with spmap in Stata: length of country names
Example map created with spmap in Stata

Related articles
Friedrich Huebler, 1 April 2007, Creative Commons License
Permanent URL: http://huebler.blogspot.com/2007/04/updates-to-two-stata-guides.html

25 March 2007

Education country profiles by UNICEF

In addition to its main web site at unicef.org, UNICEF maintains a separate web site at childinfo.org with a wide range of statistics on issues related to children and women. In the area of education, the Childinfo web site provides a complete set of country profiles with current statistics for 206 countries and territories, from Afghanistan to Zimbabwe. Complete profiles have three sections, with past trends, the current state of the education system, and prospects for 2015. The section on trends contains up to six graphs with data from 1980 to the present.
  • Pre-primary school gross and net enrollment rates
  • Primary school net enrollment and net attendance rates
  • Secondary school net enrollment and net attendance rates
  • Survival rate to grade 5
  • Pupil/teacher ratio
  • Education expenditures as percent of GDP and as percent of total government expenditures
The section on the current state of the education system lists up to two tables and six graphs.
  • Statistics from the education database of the UNESCO Institute for Statistics (UIS): population; official school ages; preschool, primary school, and secondary school enrollment; intake, transition rates, repetition, and completion rates; teaching staff; education expenditures
  • Statistics from a recent household survey, usually a Multiple Indicator Cluster Survey (MICS) or Demographic and Health Survey (DHS): primary and secondary school attendance; intake, transition, repetition, and completion rates
  • Three graphs on disparity in primary school attendance - by gender, area of residence, and household wealth - with data from a recent household survey
  • Three graphs on gender disparity in secondary school - by gender, area of residence, and household wealth - with data from a recent household survey
For countries with household survey data, two final graphs show school attendance rates between 2000 and 2015, the target year for the UN Millennium Development Goals.
  • Predicted primary school net attendance rate, by gender
  • Predicted secondary school net attendance rate, by gender
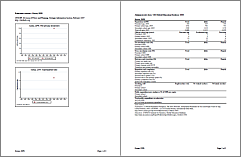
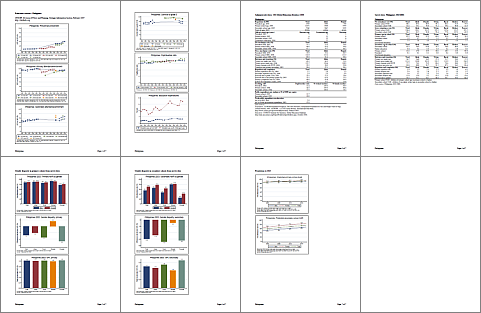
The level of detail of the country profiles varies, depending on the availability of education statistics for each country. The profile for North Korea, shown in Figure 1, has only two pages and contains virtually no data. In contrast, the country profile for the Philippines, shown in Figure 2, has seven pages with fourteen graphs and two tables and provides data for all indicators listed above.

Figure 1: Education country profile for North Korea
UNICEF's education country profile for North Korea
Source: UNICEF Childinfo web site, childinfo.org, March 2007.

Figure 2: Education country profile for the Philippines
UNICEF's education country profile for the Philippines
Source: UNICEF Childinfo web site, childinfo.org, March 2007.

On the Childinfo web site, all countries are grouped by UNICEF region. The majority of the data in the country profiles is from the UNESCO Institute for Statistics and from MICS and DHS surveys.

Related articles
External links
Friedrich Huebler, 25 March 2007, Creative Commons License
Permanent URL: http://huebler.blogspot.com/2007/03/education-country-profiles-by-unicef.html

10 March 2007

Nepal: trends in primary education, 1980-2004

Nepal is one of UNICEF's 25 priority countries for girls' education. Countries were selected if they met three or more of the following criteria:
  • female primary school net enrollment rate below 70 percent,
  • gender gap in primary education above 10 percent,
  • more than 1 million girls out of school,
  • included in the Education for All Fast Track Initiative,
  • affected by crises like HIV/AIDS and military conflict.
In Nepal, the primary school net enrollment rate (NER) of girls was historically below 70 percent and much lower than the NER of boys, with a gender gap above 10 percent. Nepal also suffers from the consequences of a long-running Maoist insurgency. Two other criteria are not met by Nepal. The country is not on the list of countries covered by the Fast Track Initiative, and the number of girls out of school is below 1 million. A recent publication by UNICEF and the UNESCO Institute for Statistics, Children out of school: Measuring exclusion from primary education, estimates that around 500,000 girls and 400,000 boys of primary school age were not attending school in Nepal.

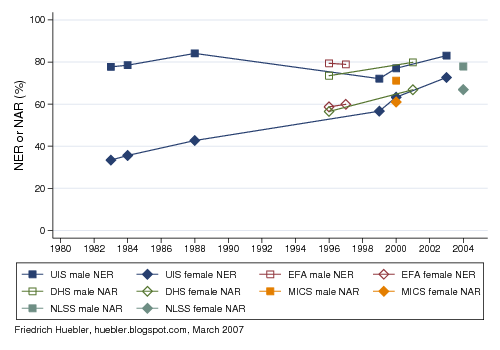
Trend data on enrollment and attendance, plotted in the following graph, shows that the primary school participation rate of girls has increased substantially since the 1980s. On the other hand, the participation rate of boys has remained relatively stable. As a result, the difference between male and female enrollment or attendance rates has decreased from more than 40 percent to roughly 10 percent over the past 25 years.

Nepal: trends in primary education, 1980-2004
Graph with trends in primary school enrollment and attendance, 1980-2004
Data sources: UNESCO Institute for Statistics, Demographic and Health Survey, Multiple Indicator Cluster Survey, Nepal Living Standards Survey.

The graph combines data from a variety of sources.
The data from UNESCO measures primary school enrollment, the data from the three household surveys - DHS, MICS, and NLSS - measures primary school attendance. The net enrollment rate (NER) is the share of children of primary school age that are enrolled in primary school. The net attendance rate (NAR) is the share of children of primary school age that attend primary school. The official primary school age in Nepal is 5 to 9 years.

In spite of some differences, the overall trends in enrollment and attendance are similar. Male NER or NAR values have hovered around 80 percent since the 1980s. In 1983, the NER of boys was 78 percent; in 2003, it was 83 percent. The latest data on primary school attendance is from a Nepal Living Standard Survey (NLSS) conducted in 2003/04. For boys, the net attendance rate at that time was 78 percent.

The female primary school NER was at 33 percent in 1983 but it more than doubled to 73 percent in 2003. The NAR of girls was 67 percent in 2003/04 according to the most recent household survey data. Because of the increase in primary school participation of girls, the gender parity index - the ratio of female to male NER or NAR values - grew from 0.4 in 1983 to more than 0.8 by 2003. If this trend continues, Nepal will reach gender parity in primary education in the coming years. However, additional progress is needed to reach the Millennium Development Goal of universal primary education by 2015.

Related articles
External links
Friedrich Huebler, 10 March 2007 (edited 12 October 2008), Creative Commons License
Permanent URL: http://huebler.blogspot.com/2007/03/nepal-trends-in-primary-school.html

27 February 2007

Global trends in primary and secondary education, 2000-2004

How close is the world to the Millennium Development Goal of universal primary education by 2015? This article looks at the trends in four indicators of primary and secondary education.
  • Primary net intake rate (NIR), the share of children who enter school at the official school entrance age. Calculation method: Primary NIR = number of new entrants to the first grade of primary school who are of official primary school entrance age / total number of children of official primary school entrance age.
  • Primary net enrollment rate (NER), the share of children of official primary school age who are enrolled in primary school. Calculation method: Primary NER = number of children of official primary school age who are enrolled in primary school / total number of children of official primary school age.
  • Secondary net enrollment rate (NER), the share of children of official secondary school age who are enrolled in secondary school. Calculation method: Secondary NER = number of children of official secondary school age who are enrolled in secondary school / total number of children of official secondary school age.
  • Survival rate to grade 5: The share of children enrolled in the first grade of primary school who eventually reach the fifth grade, regardless of grade repetition. Calculation method: Survival rate to grade 5 = number of children reaching grade 5 / number of children enrolled in grade 1.
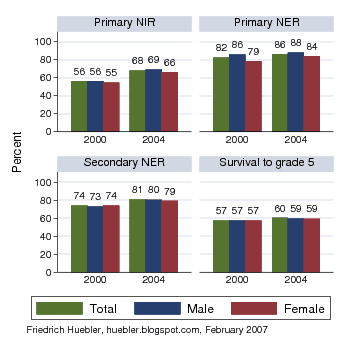
The graph and table below show how these four indicators have evolved worldwide between 2000 and 2004, the year with the most recent data on enrollment. Global values were calculated from national data obtained from UNESCO's education database. The theoretical range of all four indicators is 0 to 100 percent.

Global trends in primary and secondary education, 2000-2004
Bar graph with trends in education statistics, 2000-2004
Data source: UNESCO global education database, October 2006. - Note: Male and female survival rates are available for fewer countries than the total survival rate.

The biggest increases were observed for the primary net intake rate and the secondary net enrollment rate. The primary net intake rate increased from 56.3 to 67.8 percent, but fewer girls than boys enroll in school at the official school age. For boys, the primary net intake rate in 2004 is 68.9 percent, compared to 66.4 percent for girls. The secondary net enrollment rate grew from 73.7 to 80.7 percent. As with the net intake rate, the increase for boys exceeded that for girls but the disparity between boys' and girls' secondary enrollment rates is only 1.2 percent.

Among the indicators listed here, the primary school net enrollment rate has the highest values. Between 2000 and 2004, the primary NER increased from 82.5 to 86.4 percent. Possibly due to increased efforts to enroll girls in school, the primary NER of girls grew by 5.6 percentage points over the four-year period, compared to 2.5 percentage points for boys. As a result, the gap between the male and female primary NER fell from 7 percent in 2000 to 4 percent in 2004.

The survival rate to grade 5 showed the smallest improvement between 2000 and 2004. For all children combined, this indicator grew from 57.4 to 60.1 percent. In contrast to the other three indicators, there is no gender disparity in the survival rate to grade 5. Both boys and girls have the same probability of advancing to the fifth grade. (Note that gender disaggregated values are available for a smaller number of countries than the total survival rate. This explains why both the male and female survival rate are below the total survival rate. If data on the survival rate to grade 5 were available for all countries, the total value would lie between the male and female values.)

Global trends in primary and secondary education, 2000-2004
Indicator20002004Change 2000-2004
Primary net intake rate (%), total56.367.811.6
Primary net intake rate (%), male56.268.912.7
Primary net intake rate (%), female54.566.411.9
Primary net enrollment rate (%), total82.586.43.9
Primary net enrollment rate (%), male85.688.12.5
Primary net enrollment rate (%), female78.684.15.6
Secondary net enrollment rate (%), total73.780.77.0
Secondary net enrollment rate (%), male72.580.27.6
Secondary net enrollment rate (%), female73.679.05.4
Survival rate to grade 5 (%), total57.460.12.7
Survival rate to grade 5 (%), male57.359.21.9
Survival rate to grade 5 (%), female57.159.12.0
Data source: UNESCO global education database, October 2006. - Note: Male and female survival rates are available for fewer countries than the total survival rate.

Edit 10 March 2007: Some countries were added to the calculations and as a result the global values changed.

Related articles
External links
Friedrich Huebler, 27 February 2007 (edited 10 March 2007), Creative Commons License
Permanent URL: http://huebler.blogspot.com/2007/02/global-trends-in-primary-and-secondary.html