27 January 2008

The State of the World's Children 2008 by UNICEF

Cover of The State of the World's Children 2008 by UNICEFUNICEF released the 2008 edition of its annual publication The State of the World's Children on 22 January 2008. This year's report is dedicated to child survival and primary health care for children and their mothers.

In 2006, 9.7 million children died before they reached their fifth birthday. In spite of improvements in the area of child survival, the world is not on track to reach the Millennium Development Goal of reducing the rate of child mortality by two thirds between 1990 and 2015.

The State of the World's Children contains statistical tables with national data on nutrition, health, HIV and AIDS, education, demography, economy, women, and child protection. In the area of education, the report lists data for the following indicators:
  • Primary school enrollment and attendance
  • Secondary school enrollment and attendance
  • Survival rate to grade 5
  • Youth and adult literacy
The tables in The State of the World's Children complement the statistical review Progress for Children that was released by UNICEF in December 2007.

External links
Related articles
Friedrich Huebler, 27 January 2008 (edited 1 February 2009), Creative Commons License
Permanent URL: http://huebler.blogspot.com/2008/01/state-of-worlds-children-2008-by-unicef.html
20 January 2008

Secondary school attendance in India in 2006

In India, 83 percent of all children of primary school age (6-10 years) attend primary school, as described in a previous article on this site. Primary school net attendance rates (NAR) are highest in urban areas and among children from the richest households.

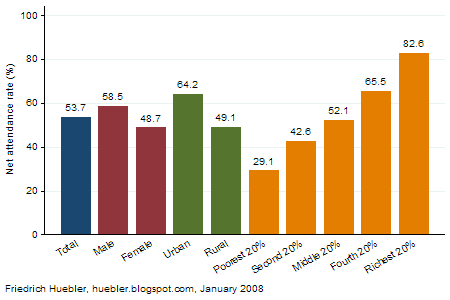
Fewer children continue their education at the secondary level. Data from a nationally representative Demographic and Health Survey (called National Family Health Survey in India) conducted in 2005 and 2006 shows that only 54 percent of all children of secondary school age (11-17 years) attend secondary school. In addition, there are large disparities between different groups of children, as the graph below demonstrates. Boys and children from urban areas are more likely to be in secondary school than girls and children from rural areas.

Secondary school net attendance rate (NAR), India 2006
Bar graph showing secondary school net attendance rate in India in 2006
Data source: India Demographic and Health Survey 2005-06.

The biggest disparities exist between children from different wealth quintiles. Among children from the richest 20 percent of all households, the secondary NAR is 83 percent, compared to a secondary NAR of only 29 percent among children from the poorest households. The respective primary NAR values are 96 percent for children from the richest quintile and 69 percent for children from the poorest quintile. Children from poor households are not only less likely to enter school than children from wealthier households, they are also far less likely to continue their education after four years of primary school.

References
  • International Institute for Population Sciences (IIPS), and Macro International. 2007a. National Family Health Survey (NFHS-3) 2005-06, India: Volume 1. Mumbai: IIPS. (Download in PDF format, 7.9 MB)
  • International Institute for Population Sciences (IIPS), and Macro International. 2007b. National Family Health Survey (NFHS-3) 2005-06, India: Volume II. Mumbai: IIPS. (Download in PDF format, 4.1 MB)
Related articles
External links
Friedrich Huebler, 20 January 2008 (edited 12 October 2008), Creative Commons License
Permanent URL: http://huebler.blogspot.com/2008/01/secondary-school-attendance-in-india-in.html

13 January 2008

Universal primary education by 2015: A goal out of reach?

The new UNICEF publication Progress for Children compares data on children out of school by UNESCO and UNICEF. According to UNESCO, 72 million children of primary school age were out of school in 2005, down from 96 million in 1999. UNICEF estimates that 93 million children were out of school in 2005/2006, down from 115 million in 2002. Although both sets of data show a decline in the number of children out of school, they also indicate that the Millennium Development Goal of universal primary education by 2015 may be out of reach.

The graph below plots trend data on the number of children out of school calculated by UNESCO for the period 1999-2005 and by UNICEF for the period 2002-2006. (The 2002 estimate in the latter trend line is based on joint work by UNICEF and the UNESCO Institute for Statistics.) If we assume that the reduction in the number of children out of school continues at the same average rate as over the past years, more than 30 to 40 million children will still be out of school by 2015 and the international community will have failed in its efforts to secure primary education for all children.

Children out of school, 1999-2015
Graph with trend data on number of children out of school, 1999-2015
Data sources: UIS (2005), UNESCO (2007), UNICEF (2007).

References
  • UNESCO Institute for Statistics (UIS). 2005. Children out of school: Measuring exclusion from primary education. Montreal: UIS. (Download in PDF format, 4.9 MB)
  • UNESCO. 2007. Education for all by 2015: Will we make it? - EFA global monitoring report 2008. Paris: UNESCO. (Download in PDF format, 11.8 MB)
  • UNICEF. 2007. Progress for Children: A World Fit for Children Statistical Review. New York: UNICEF. (Download in PDF format, 3.6 MB)
Related articles
External links
Friedrich Huebler, 13 January 2008 (edited 8 February 2009), Creative Commons License
Permanent URL: http://huebler.blogspot.com/2008/01/universal-primary-education-by-2015.html