In 1996, only one in five children of secondary school age attended secondary school. By 2006, the secondary school NAR had doubled from 21 percent to 42 percent. The biggest relative increase was observed among the poorest households. In the poorest household quintile, the secondary school NAR more than tripled from 8 percent in 1996 to 28 percent in 2006. Most of this increase occurred over the period 2001 to 2006, when attendance rates in the richest households grew only marginally.
Secondary school net attendance rate (%), Nepal 1996-2006
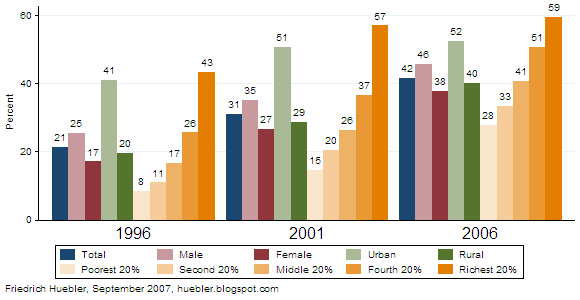
Data source: Nepal Demographic and Health Surveys, 1996, 2001, 2006.
The attendance rates of boys and girls grew by more than 20 percent between 1996 and 2006. The absolute gap between the two groups stayed the same, around 8 percent. The relative gap, measured by the gender parity index, the ratio of female to male attendance rate, improved from 0.67 to 0.83. The latest value is below the gender parity index in primary education, 0.95, but it brings the country closer to the Millennium Development Goal of gender parity in primary and secondary education.
Rural children managed to reduce the gap with urban children. In 1996, the secondary school NAR in urban areas was twice as high as in rural areas (41 versus 20 percent) but by 2006 the NAR in rural areas had doubled to 40 percent, while the NAR in urban areas grew to 52 percent.
Secondary school net attendance rate (%), Nepal 1996-2006
| 1996 | 2001 | 2006 | Change 1996 to 2006 | |
| Total | 21.3 | 30.9 | 41.7 | 20.4 |
| Male | 25.4 | 35.1 | 45.7 | 20.3 |
| Female | 17.1 | 26.6 | 37.8 | 20.8 |
| Urban | 40.9 | 50.6 | 52.4 | 11.5 |
| Rural | 19.5 | 28.7 | 40.1 | 20.5 |
| Poorest 20% | 8.4 | 14.6 | 27.8 | 19.4 |
| Second 20% | 10.9 | 20.5 | 33.3 | 22.4 |
| Middle 20% | 16.7 | 26.4 | 40.6 | 23.9 |
| Fourth 20% | 25.6 | 36.5 | 50.8 | 25.2 |
| Richest 20% | 43.3 | 57.0 | 59.5 | 16.1 |
Related articles
- Primary school attendance in Nepal, 1996-2006
- Primary and secondary school attendance in Nepal
- Nepal: trends in primary education, 1980-2004
- Caste, ethnicity, and school attendance in Nepal
- Education disparity in South Asia
- Education for All Global Monitoring Report 2007
Friedrich Huebler, 26 September 2007 (edited 12 October 2008), Creative Commons License
Permanent URL: http://huebler.blogspot.com/2007/09/secondary-school-attendance-in-nepal.html

