A comparison of primary and secondary school net attendance rates (NAR) reveals that virtually all primary school children from the richest 20% of all households go on to attend secondary school. For children from the poorest 20% of all households, the NAR drops from 64.0% at the primary level to 32.3% at the secondary level. Rural children are also much less likely to stay in school than urban children.
Secondary school net attendance rate, India 2000
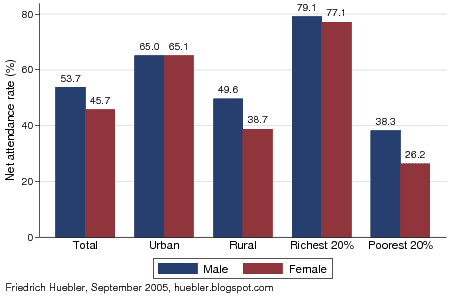
Data source: India 2000 MICS.
The gender disparity that can be observed at the primary level is even more pronounced at the secondary level. The secondary school NAR among boys was 53.7%, compared to 45.7% for girls. A disaggregation of the data shows that this disparity at the country level is a consequence of gender discrimination in rural areas and among poor households. In urban areas and among the richest households, the gender parity index (GPI) - the ratio of female to male NAR - is at or close to 1. Rural girls and girls from the poorest household, on the other hand, are much less likely to attend secondary school than their male peers.
Secondary school net attendance rate, India 2000
| Total NAR (%) | Male NAR (%) | Female NAR (%) | Difference male- female | GPI female/ male | |
| Urban | 65.1 | 65.0 | 65.1 | -0.1 | 1.00 |
| Rural | 44.2 | 49.6 | 38.7 | 10.8 | 0.78 |
| Richest 20% | 78.1 | 79.1 | 77.1 | 1.9 | 0.98 |
| Poorest 20% | 32.3 | 38.3 | 26.2 | 12.0 | 0.69 |
| Total | 49.7 | 53.7 | 45.7 | 8.0 | 0.85 |
Friedrich Huebler, 25 September 2005 (edited 27 January 2007), Creative Commons License