The number of children out of school is an important indicator to track progress toward the Millennium Development Goal of universal primary education. According to a joint report by the UNESCO Institute for Statistics and UNICEF that was published this week, 115 million children of primary school age are not in school.
The report with the title Children out of school: Measuring exclusion from primary education describes a new approach to measure the number of children out of school. Typically, the number of children out of school is based on the primary school net enrollment rate (NER), which is calculated as follows:
Primary school NER = number of children of primary school age enrolled in primary school / number of children of primary school age
The share of children out of school is assumed to be the difference between the theoretical NER at full enrollment and the current NER:
Share of children out of school = 100% - primary school NER
In many countries some children of primary school age are already attending secondary school and these children are mistakenly counted as out of school if the formula above is used. The report by UNESCO and UNICEF relies on an improved method that counts children of primary school age who are attending primary or secondary school. Children of primary school age who are still in preschool or who are in non-formal education (for example religious schools) are counted as out of school because they are not receiving the education they should get at their age.
The report also breaks new ground because it evaluates both administrative data on enrollment and attendance data from household surveys. UNESCO publications like the Global Education Digest usually only evaluate data from administrative records that are provided by national governments. Data from 80 household surveys allowed the authors to fill gaps in the administrative data and made it possible to explore the child and household characteristics associated with schooling status. The report finds, for example, that children from the poorest household quintile are three times as likely to be out of school as children from the richest quintile. A detailed appendix has statistics on children out of school for all countries. The data is mostly for the 2001/02 school year, the latest year with data at the time the report was written.
Regional distribution of children out of school, 2001/02
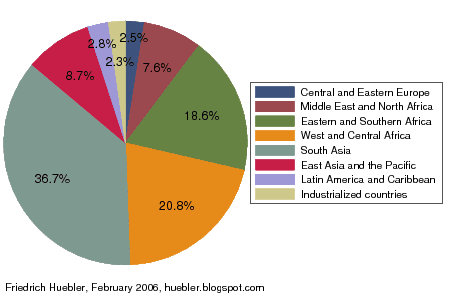
Data source: UNESCO Institute for Statistics (UIS). 2005. Children out of school: Measuring exclusion from primary education. Montreal: UIS. Table 1.1, page 18.
The majority of the 115 million children out of school live in Sub-Saharan Africa, as the graph above shows. 24.0 million (20.8 percent of the total) live in West and Central Africa and another 21.4 million (18.6 percent) in Eastern and Southern Africa. South Asia is home to 42.3 million or 36.7 percent of all children out of school. 10.0 million children not in school (8.7 percent) live in East Asia and 8.8 million (7.6 percent) in the Middle East and North Africa. The remaining regions have relatively high primary school enrollment rates and are therefore home to fewer children out of school. Latin America and the Caribbean contribute 3.3 million (2.8 percent) of the global population of children out of school, 2.9 million (2.5 percent) live in Central and Eastern Europe and 2.6 million (2.3 percent) in the industrialized countries. The regional groupings are those used by UNICEF (see the map in an article on regional trends in primary school enrollment).
- Download Children out of school: Measuring exclusion from primary education (PDF, 4.9 MB)
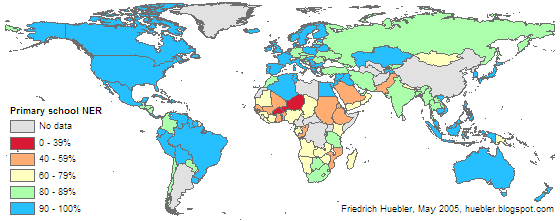
- Primary school enrollment 2002/03
- Primary school gross and net enrollment
- Regional trends in primary school enrollment
- Education data from household surveys