The graphs and maps on this site are created with the Stata statistical package. This article describes how to make maps like those showing Millennium Development Goal regions and UNICEF regions in Stata from a shapefile.
Shapefiles store geographic features and related information and were developed by ESRI for its ArcGIS line of software. The shapefile format is used by many other programs and maps in this format can be downloaded from various sites on the Internet. Another common map format is the MapInfo Interchange Format for use with the MapInfo software. Shapefile data is usually stored in a set of three files (.shp, .shx, .dbf), while MapInfo data is stored in two files (.mif, .mid). Some sources for shapefiles and other data are listed on the website of the U.S. Centers for Disease Control and Prevention (CDC) under "Resources for Creating Public Health Maps." The CDC itself provides shapefiles for all countries with administrative boundaries down to the state level. Please note that these shapefiles are not in the public domain and are intended for use with the CDC's Epi Info software only. Other sources of shapefiles can be found with a Google search.
This guide is divided into two parts. Read part 1 if you have Stata 9 or 10 and part 2 if you have Stata 8. The creation of maps is not supported in older versions of Stata.
Part 1: Creating maps with Stata 9 or 10
To create a map with Stata 9 or 10 you need the following software.
- Stata version 9.2 or newer.
- spmap: Stata module for drawing thematic maps, by Maurizio Pisati. Install in Stata with the command "ssc install spmap".
- shp2dta: Stata module for converting shapefiles to Stata format, by Kevin Crow. Install in Stata with the command "ssc install shp2dta".
- Shapefile: For the example in this guide, download world_adm0.zip (646 KB), a shapefile that contains the boundaries of all countries of the world.
- Unzip world_adm0.zip to a folder that is visible to Stata. The archive contains three files called world_adm0.dbf, world_adm0.shp, and world_adm0.shx.
- Start Stata and run this command:
shp2dta using world_adm0, data(world-d) coor(world-c) genid(id)
Two new files will be created: world-d.dta (with the country names and other information) and world-c.dta (with the coordinates of the country boundaries). If you plan to superimpose labels on a map, for example country names, you should run the following command instead, which will add centroid coordinates to the file world-d.dta:
shp2dta using world_adm0, data(world-d) coor(world-c) genid(id) genc(c)
Please refer to the spmap documentation to learn more about labels because they are not covered in this guide. - The DBF, SHP, and SHX files can be deleted.
Step 2: Draw map in Stata
- Open world-d.dta in Stata.
- The file contains no country-specific data that could be used for this example so we will create a variable with the length of each country's name. The Stata command for this is:
generate length = length(NAME) - Draw a map that indicates the length of all country names with this command:
spmap length using "world-c.dta", id(id)
Be patient because spmap is slow if a map contains many features. - The default map is monochrome, it shows Antarctica, the legend is too small and the legend values are arranged from high to low. We can draw a second map without Antarctica, with a blue palette, and with a bigger legend with values arranged from low to high:
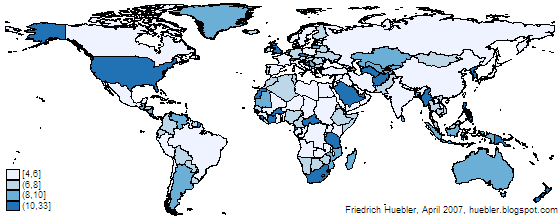
spmap length using "world-c.dta" if NAME!="Antarctica", id(id) fcolor(Blues) legend(symy(*2) symx(*2) size(*2)) legorder(lohi)
Map created with spmap in Stata: length of country names
The instructions above can be used to convert any shapefile to Stata format. If you have maps in MapInfo format you have to use another program called mif2dta that is described in part 2 of this guide.
Part 2: Creating maps with Stata 8
To create a map with Stata 8 you need the following software.
- Stata version 8.2.
- tmap: Stata module for thematic mapping by Maurizio Pisati. Install in Stata with the command "ssc install tmap".
- mif2dta: Stata module for converting files from MapInfo to Stata format, also by Maurizio Pisati. Install in Stata with the command "ssc install mif2dta".
- SHP2MIF: DOS program for converting shapefiles to MapInfo format. Go to the the website of RouteWare and click on "SHP2MIF (135 Kb)" under the heading "Converters" to get ishp2mif.zip.
- Shapefile: For the example in this guide, download world_adm0.zip (646 KB), a shapefile that contains the boundaries of all countries of the world.
- Unzip ishp2mif.zip. The archive contains three files, among them SHP2MIF.EXE.
- Unzip world_adm0.zip to the same folder as SHP2MIF.EXE. The archive contains three files called world_adm0.dbf, world_adm0.shp, and world_adm0.shx.
- Open a DOS command window: Windows Start menu - Run - "command" - OK.
- Change the path in the command window to the folder that contains SHP2MIF.EXE and the three map files. Use the DOS command "cd" to change the path.
- SHP2MIF works best with short file names in the 8.3 format (name up to 8 characters, extension up to 3 characters). Rename the map files with this DOS command:
rename world_adm0.* world.*
The map files are now called world.dbf, world.shp, and world.shx. - Convert the maps to MapInfo format by typing "shp2mif world" in the DOS command window. This produces two new files: WORLD.MID and WORLD.MIF.
- Close the DOS command window.
- The DBF, SHP and SHX files can be deleted.
- Move the MIF and MID files to a folder that is visible to Stata.
- Start Stata and run this command:
mif2dta world, genid(id)
Two new files will be created: world-Coordinates.dta (with the country boundaries) and world-Database.dta (with the country names and other information). If you plan to superimpose labels on a map, for example country names, you should run the following command instead, which will add centroid coordinates to the file world-Database.dta:
mif2dta world, genid(id) genc(c)
Please refer to the tmap documentation to learn more about labels because they are not covered in this guide. - The MIF and MID files can be deleted.
- Open world-Database.dta in Stata.
- The file contains no country-specific data that could be used for this example so we will create a variable with the length of each country's name. The Stata command for this is:
generate length = length(name) - Draw a map that indicates the length of all country names with this command:
tmap choropleth length, map(world-Coordinates.dta) id(id)
Be patient because tmap is slow if a map contains many features. - The default map is monochrome, it shows Antarctica and the legend is too small. We can draw a second map without Antarctica, with a blue palette, and with a bigger legend:
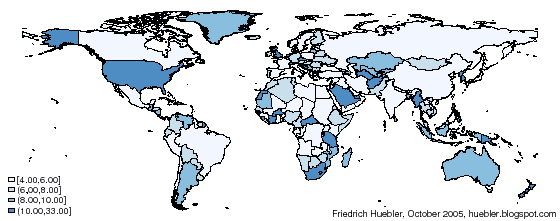
tmap choropleth length if name!="Antarctica", map(world-Coordinates.dta) id(id) palette(Blues) legsize(2) - To reduce the margins, display the graph again and set the margins to zero:
graph display, margins(zero)
Map created with tmap in Stata: length of country names
The instructions above can be used to convert any shapefile to Stata format. If you have maps in MapInfo format you can skip step 1 of the instructions and start with step 2.
Related articles
- Guide to creating maps with Stata (new version of this guide, which supersedes the version on this page)
- Guide to integrating Stata and external text editors
- Guide to creating PNG images with Stata
- Guide to reading Statalist with Gmail
- Stata FAQ: How do I graph data onto a map?
- Wikipedia article on shapefiles
- Wikipedia article on MapInfo Interchange Format
- Resources for Creating Public Health Maps from the Centers for Disease Control and Prevention (CDC)
Permanent URL: http://huebler.blogspot.com/2005/11/creating-maps-with-stata.html


21 comments:
This is great. Thank you!
Excellent blog! Thx a lot for the tips!
Hi! i'm a student of a master in economics, right now i'm doing my thesis in order to obtain my MA, and the field i'm researching is in public finance. I'm using Spatial Regressions for a data panel in Chile, i would really appreciate if someone could give me some tips in how to estimate such a model with STATA. thanks!
Diego, the Stata mailing list is a good place to ask for help.
http://www.stata.com/statalist
Quoting from the page above, "Statalist is an email listserver where over 2,500 Stata users from experts to neophytes maintain a lively dialogue about all things statistical and Stata."
Thanks a lot!!! Being in a rush for a presentation, I thought it might be cool to show maps. Your tutorial helped me to manage that in only a few minutes.
Thanks from South America using it to show tax gaps for province
Hi, I succesfully used spmap to produce mortality map. But, I face difficulty when I try to combine 2 map in one page. I used this command:
spmap mmortality using "indocoor.dta", id(id) fcolor(Blues)
spmap puskesmas using "indocoor.dta", id(id)fcolor(Blues)
and then I combine both map with this command:
gr combine "mmortality" "puskesmas", col(1) iscale(1)
But it doesnt work. Could anyone please tell me the right way?
Sujarwoto, I would suggest that you post your question to the Stata mailing list.
Mas Sujarwoto,
Salam Kenal.
I think you should save the graph first before combine them.
So after the first graph you type
graph save mortality
and then run the second one
then
graph save puskesmas
Then, you should be able to combine after that.
Good luck!!
Hi, I have a Stata 9.0SE version installed on my PC, which version should I use? I understand from your guide that spmap works with 9.2 onwards and tmap only with 8.2...
Many thanks
Filippo
Filippo, Stata 9.2 is a free update from Stata 9.0. To update the software, type -update query- in Stata and follow the instructions. After the update you can install spmap.
Thanks for this great intro! How may I change the shading's categories though? That is, how can select the number of categories and which percentages/value ranges are attributed to which color?
Thanks again,
Andy
Andy, type help spmap in Stata to access the help file for spmap. The information you need is in the section on choropleth maps. Some of the options that can be specified are clmethod (specifies the method to be used for classifying variable attribute and representing its spatial distribution) and fcolor (specifies the list of fill colors of the base map polygons).
Thank you very much - works like a charm!
Dear Prof Friedrich
I have followed your way in creating a map but I am still not satisfied with the result. I prefer to show the data (indicator) on every country/region (eg. population). Could you please help me how to make it?
Inggrid, the help file for spmap is very detailed and explains all options, with many examples. To access the help file, enter help spmap in Stata. If you cannot find the answer in the help file, I would recommend that you send a message about your problem to Statalist.
How may I change the shading's categories though? That is, how can select the number of categories and which percentages/value ranges are attributed to which color?
The options related to category specification are described in the help file for spmap. Please enter help spmap in the Stata command window to access the help file and refer to the section on choropleth maps. Among other options, you will find clmethod (for classifying variable attributes) and fcolor (for fill colors of the map polygons) useful.
Thanks Friedrich Huebler..... great job.
Gracias desde Ecuador.
Hello! I am a college student. I ran the command -tmap-, but the chart shows extra lines. I followed what was written on statist, but nothing (for example, the graph shows a triangle in the Indian Ocean). How can I fix?. Thanks.
PS.: I use STATA 11
You have Stata 11 and can therefore use -spmap-, the successor to -tmap- by the same author. Questions about -spmap- or other Stata add-ons can be posted to Statalist.
Post a Comment