Showing posts with label India. Show all posts

30 April 2010

Age distribution by wealth quintile in household survey data

Household survey data may not contain precise ages for all household members. Age heaping, an unusually high share of ages ending in 0 and 5, is especially common in survey data from developing countries. Age heaping can be caused by uncertainty of survey respondents about their own age or the age of other household members, intentional misreporting, or errors during data collection and processing. Errors in age data can affect the estimation of education indicators from household survey data because these indicators are often calculated for specific age groups. Examples include the youth literacy rate and school attendance rates for the population of primary and secondary school age.

An article on age distribution in household survey data on this site demonstrated age heaping in survey data from India, Nigeria and to a lesser extent Indonesia. Data for Brazil showed little to no age heaping. To investigate whether age heaping is more common among certain segments of the population, the survey samples can be disaggregated by household wealth quintile. For this purpose, the households in the sample are first ranked by wealth, from poorest to richest. The population is then divided into five equally sized groups with 20 percent each of all household members in the sample.

Figure 1 shows the age distribution by single year of age and wealth quintile in data from Brazil. The data were collected in 2006 with a Pesquisa Nacional por Amostra de DomicĂ­lios (PNAD) or National Household Sample Survey. No preference for ages ending in 0 and 5 could be observed for the entire survey sample combined and disaggregation does not change the result. The age distribution in each quintile is smooth, with no peaks at ages ending in 0 and 5. The only obvious difference between the population in the different quintiles is that poorer families tend to have more children, indicated by a peak in the age distribution in the younger age groups.

Figure 1: Age distribution in household survey data by single-year age group and household wealth quintile, Brazil
Line graph with age distribution in survey data from Brazil by single-year age group and household wealth quintile
Data source: Brazil PNAD 2006.

Figure 2 shows the age distribution in Demographic and Health Survey (DHS) data from India. The data were collected in 2005-06. In contrast to Brazil, there is considerable age heaping in the Indian data. However, peaks around ages ending in 0 and 5 are more pronounced among poorer households. Increasing household wealth is associated with a decrease in age heaping.

Figure 2: Age distribution in household survey data by single-year age group and household wealth quintile, India
Line graph with age distribution in survey data from India by single-year age group and household wealth quintile
Data source: India DHS 2005-06.

Data from Indonesia, collected with a Demographic and Health Survey in 2007, are shown in Figure 3. At the aggregate level, the survey data from Indonesia exhibit little age heaping. However, disaggregation by wealth quintile reveals that reported ages ending in 0 and 5 are more common among poorer households.

Figure 3: Age distribution in household survey data by single-year age group and household wealth quintile, Indonesia
Line graph with age distribution in survey data from Indonesia by single-year age group and household wealth quintile
Data source: Indonesia DHS 2007.

Finally, Figure 4 displays data from a 2008 Demographic and Health Survey in Nigeria. Similar to India, there is a high percentage of ages ending in 0 and 5 in the combined survey sample. The disaggregated data show that age heaping occurs more frequently among poorer households but also exists in the richest wealth quintile.

Figure 4: Age distribution in household survey data by single-year age group and household wealth quintile, Nigeria
Line graph with age distribution in survey data from Nigeria by single-year age group and household wealth quintile
Data source: Nigeria DHS 2008.

Disaggregation of household survey data from Brazil, India, Indonesia and Nigeria has shown that age heaping occurs more frequently in data collected from poorer households. Wealthier households may have more access to birth registration and therefore may be able to verify their ages with birth certificates. Wealthier households are also likely to be smaller and survey respondents would therefore have to know and report the ages of fewer persons than respondents from larger households.

Age heaping in survey data reduces the accuracy of education indicators that are calculated for single years of age, for example for all children of primary school entrance or graduation age. However, indicator estimates for larger age groups, for example all children of primary or secondary school age, are less likely to be affected by errors in age data.

Related articles
External links
Friedrich Huebler, 30 April 2010, Creative Commons License
Permanent URL: http://huebler.blogspot.com/2010/04/age.html

28 February 2010

Age distribution in household survey data

Indicators in the field of education statistics, such as those defined in the education glossary of the UNESCO Institute for Statistics, are typically calculated for specific age groups. For example, the youth literacy rate is for the population age 15 to 24 years, the adult literacy rate for the population age 15 and over, and the net attendance rates for primary and secondary education are for the population of primary and secondary school age, respectively. The net intake rate is an example for an indicator that is calculated for a single year of age, the official start age of primary school.

For a correct calculation of education indicators it is necessary to have precise age data. In the case of data collected with population censuses or household surveys this means that the ages recorded for each household member should be without error. However, census or survey data sometimes exhibit the phenomenon of age heaping, usually on ages ending in 0 and 5. Such heaping or digit preference occurs when survey respondents don't know their own age or the ages of other household members, or when ages are intentionally misreported.

The presence of age heaping can be tested with indices of age preference such as Whipple's index. Heaping can also be detected through visual inspection of the age distribution in household survey data. Figures 1 and 2 summarize the age distribution in survey data from Brazil, India, Indonesia and Nigeria. The data from Brazil were collected with a Pesquisa Nacional por Amostra de DomicĂ­lios or National Household Sample Survey in 2006. The data for the other three countries are from Demographic and Health Surveys conducted between 2005 and 2008.

Figure 1 shows the share of single years of age in the total survey sample. A preference for ages ending in 0 and 5 is strikingly obvious in the data from India and Nigeria. In the data from Indonesia, age heaping is also present, but to a lesser extent than for India and Nigeria. Lastly, the graph for Brazil is relatively smooth, indicating a near absence of age heaping.

Figure 1: Age distribution in survey data by single-year age group
Line graph with age distribution in survey data by single-year age group
Data source: Brazil PNAD 2006, India DHS 2005-06, Indonesia DHS 2007, Nigeria DHS 2008.

In Figure 2, single ages are combined in five-year age groups, from 0-4 years and 5-9 years to 90-94 years and 95 years and over. Compared to Figure 1, the distribution lines are much smoother, including for India and Nigeria. We can conclude that age heaping is problematic for education indicators that are calculated for single years, for example all children of primary school entrance age, but less so for indicators that are calculated for a larger age group, for example all children of primary or secondary school age or all persons over 15 years of age.

Figure 2: Age distribution in survey data by five-year age group
Line graph with age distribution in survey data by five-year age group
Data source: Brazil PNAD 2006, India DHS 2005-06, Indonesia DHS 2007, Nigeria DHS 2008.

Related articles
External links
Friedrich Huebler, 28 February 2010 (edited 30 September 2010), Creative Commons License
Permanent URL: http://huebler.blogspot.com/2010/02/age.html

01 November 2008

Education disparity trends in South Asia

An article on education disparity in South Asia described a newly developed Education Parity Index (EPI). This index combines data on primary school attendance, secondary school attendance and the survival rate to the last grade of primary school, disaggregated by gender, area of residence and household wealth. The value of the EPI has a theoretical range of 0 to 1, where 1 indicates absolute parity.

Through a combination of survey data from several years it is possible to analyze trends in disparity as measured by the EPI. For the trend analysis, data from the following South Asian household surveys - mainly Demographic and Health Surveys (DHS) and Multiple Indicator Cluster Surveys (MICS) - were available.
  • Afghanistan: 2003 MICS
  • Bangladesh: 1999-2000 DHS, 2004 DHS, 2006 DHS
  • India: 1998-99 DHS, 2000 MICS, 2005-06 DHS
  • Nepal: 1996 DHS, 2000 MICS, 2001 DHS, 2006 DHS
  • Pakistan: 2000-01 survey, 2006-07 DHS
The graph below plots the EPI values calculated from each survey. Due to a lack of data, no trends can be shown for Afghanistan.

Education disparity trends in South Asia, 1996-2007
Trend lines with Education Parity Index values between 1996 and 2007
Data source: Demographic and Health Surveys (DHS), Multiple Indicator Cluster Surveys (MICS), 1996-2007.

In Bangladesh, India and Nepal, the EPI has increased from the earliest to the latest year with data, indicating a decrease in disparity over the period of observation. In Bangladesh, the EPI grew from 0.79 in 2000 to 0.84 in 2006. In India, the EPI was at 0.77 in 1999 and 0.82 in 2006. In Nepal, the EPI shows the biggest increase, from 0.67 in 1996 to 0.83 in 2006, interrupted by a decrease from 2000 to 2001. Compared to the other countries, Nepal has thus made the most progress toward parity in the education system.

For Pakistan, the EPI has decreased from 2000 to 2007, indicating an increase in disparity. However, an inspection of the underlying data reveals that the earlier survey did not provide data on household wealth. Disparities related to wealth are usually greater than disparities related to gender or area of residence. If data on wealth had been available, the EPI for 2000 would most likely have been lower. The data from the 2006-07 DHS confirm this assumption. Children from the poorest quintile have much lower attendance and survival rates than children from the richest quintile, and the disparity between these two groups of children is much greater than the disparity between boys and girls and between children from urban and rural households. For example, the primary school net attendance rate (NAR) in Pakistan is 46 percent among children from the poorest household quintile but twice as high, 93 percent, among children from the richest quintile. In comparison, the primary NAR is 76 percent for boys, 67 percent for girls, 82 percent for urban children, and 67 percent for rural children according to the 2006-07 DHS.

The data gaps in the graph bring to attention one limitation of the EPI. The net enrollment rate and other data published annually by UNESCO in the Global Education Digest or the Education For All Global Monitoring Report are not disaggregated beyond gender and can therefore not be used to calculate the EPI. On the other hand, national household survey data, which permit the required level of disaggregation, are not collected every year but only every four or five years, on average.

Related articles
External links
Friedrich Huebler, 1 November 2008 (edited 22 November 2008), Creative Commons License
Permanent URL: http://huebler.blogspot.com/2008/11/south-asia.html

12 October 2008

Education disparity in South Asia

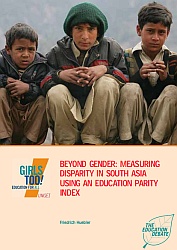
Cover of "Beyond gender: Measuring disparity in South Asia using an education parity index" by Friedrich HueblerA new publication by Friedrich Huebler describes education disparity in the countries of South Asia. The report Beyond gender: Measuring disparity in South Asia using an education parity index was published by the UNICEF regional office for South Asia in its series of papers on girls' education.

Analysis of disparities in national education systems is often limited to gender although other dimensions of disparity are also important. The publication presents data on disparity in primary and secondary education by gender, area of residence and household wealth for countries in South Asia.

To facilitate the interpretation of complex data a newly developed Education Parity Index is introduced. The EPI combines information on disparities across different education indicators and across different groups of disaggregation. This distinguishes the EPI from existing indicators of disparity in education, including the gender parity index and the EFA development index. The EPI is flexible and can be modified according to national priorities, for example by including information on disparities between different ethnic groups.

The use of the EPI as a tool to assess education disparities is illustrated with household survey data from Afghanistan, Bangladesh, India, Nepal and Pakistan. For each country, the report describes how the EPI is calculated. In addition, national trends in education disparity from 1996 to 2006 are presented.

References
  • Huebler, Friedrich. 2008. Beyond gender: Measuring disparity in South Asia using an education parity index. Kathmandu: UNICEF. (Download PDF document, 194 KB)
External links
Related articles
Friedrich Huebler, 12 October 2008 (edited 9 September 2012), Creative Commons License
Permanent URL: http://huebler.blogspot.com/2008/10/epi.html

20 January 2008

Secondary school attendance in India in 2006

In India, 83 percent of all children of primary school age (6-10 years) attend primary school, as described in a previous article on this site. Primary school net attendance rates (NAR) are highest in urban areas and among children from the richest households.

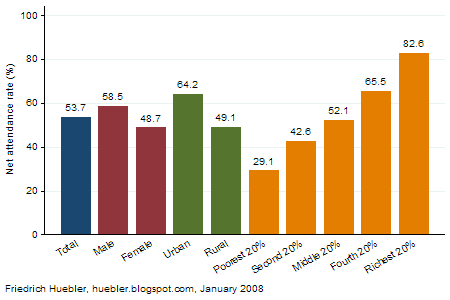
Fewer children continue their education at the secondary level. Data from a nationally representative Demographic and Health Survey (called National Family Health Survey in India) conducted in 2005 and 2006 shows that only 54 percent of all children of secondary school age (11-17 years) attend secondary school. In addition, there are large disparities between different groups of children, as the graph below demonstrates. Boys and children from urban areas are more likely to be in secondary school than girls and children from rural areas.

Secondary school net attendance rate (NAR), India 2006
Bar graph showing secondary school net attendance rate in India in 2006
Data source: India Demographic and Health Survey 2005-06.

The biggest disparities exist between children from different wealth quintiles. Among children from the richest 20 percent of all households, the secondary NAR is 83 percent, compared to a secondary NAR of only 29 percent among children from the poorest households. The respective primary NAR values are 96 percent for children from the richest quintile and 69 percent for children from the poorest quintile. Children from poor households are not only less likely to enter school than children from wealthier households, they are also far less likely to continue their education after four years of primary school.

References
  • International Institute for Population Sciences (IIPS), and Macro International. 2007a. National Family Health Survey (NFHS-3) 2005-06, India: Volume 1. Mumbai: IIPS. (Download in PDF format, 7.9 MB)
  • International Institute for Population Sciences (IIPS), and Macro International. 2007b. National Family Health Survey (NFHS-3) 2005-06, India: Volume II. Mumbai: IIPS. (Download in PDF format, 4.1 MB)
Related articles
External links
Friedrich Huebler, 20 January 2008 (edited 12 October 2008), Creative Commons License
Permanent URL: http://huebler.blogspot.com/2008/01/secondary-school-attendance-in-india-in.html

09 December 2007

Primary school attendance by state in India

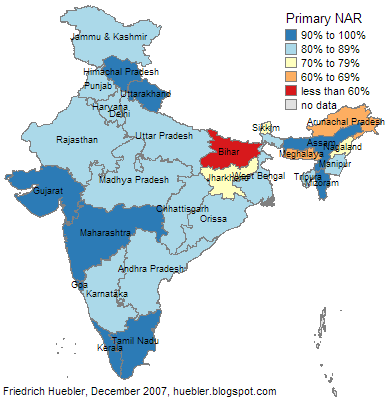
The average primary school net attendance rate in India is 83 percent according to data from a Demographic and Health Survey (DHS) conducted in 2005 and 2006. However, the national average hides considerable regional variation in primary school attendance. India is divided into 28 states and 7 union territories. With the DHS data it is possible to calculate the primary school NAR in 29 states and territories, shown in the map and table below.

Primary school attendance in India by state and territory, 2006
Map showing primary school attendance in India by state and territory, 2006
Data source: India DHS 2005-06

The states with the highest primary school net attendance rates, between 98 and 99 percent, are Himachal Pradesh, Kerala, and Tamil Nadu. In these states, virtually all children of primary school age are in school. Six other states also have primary NAR values above 90 percent: Assam, Goa, Gujarat, Maharashtra, Mizoram, and Uttarakhand. In fifteen states and territories the primary NAR is between 80 and 90 percent.

In six states, fewer than four out of five children of primary school age are in school: Arunachal Pradesh, Bihar, Jharkhand, Meghalaya, Nagaland, and Sikkim. By far the lowest primary school attendance rates are observed in Bihar (59 percent) and Meghalaya (60 percent), two of the poorest and economically least developed states of India.

Primary school attendance in India by state and territory, 2006
State or Territory Primary NAR (%) State or Territory Primary NAR (%)
Andaman and Nicobar Islands - Lakshadweep -
Andhra Pradesh 89.2 Madhya Pradesh 81.0
Arunachal Pradesh 67.3 Maharashtra 91.7
Assam 91.1 Manipur 80.3
Bihar 58.5 Meghalaya 60.4
Chandigarh - Mizoram 91.8
Chhattisgarh 86.5 Nagaland 71.9
Dadra and Nagar Haveli - Orissa 86.8
Daman and Diu - Puducherry -
Delhi 89.9 Punjab 89.1
Goa 94.1 Rajasthan 81.0
Gujarat 91.1 Sikkim 77.6
Haryana 87.6 Tamil Nadu 98.5
Himachal Pradesh 97.8 Tripura 89.6
Jammu and Kashmir 86.7 Uttar Pradesh 81.4
Jharkhand 72.1 Uttarakhand 93.4
Karnataka 88.5 West Bengal 85.1
Kerala 98.1 India 83.3
Data source: India DHS 2005-06

Related articles
External links
Friedrich Huebler, 9 December 2007 (edited 12 October 2008), Creative Commons License
Permanent URL: http://huebler.blogspot.com/2007/12/primary-school-attendance-by-state-in.html

19 November 2007

Primary school attendance in India in 2006

21 million children of primary school age in India were out of school in 2006, more than in any other country. Compared to 2000, the number of children out of school has fallen by 9 million, but the Millennium Development Goal of universal primary education by 2015 can only be met if the increase in primary school attendance accelerates in the coming years.

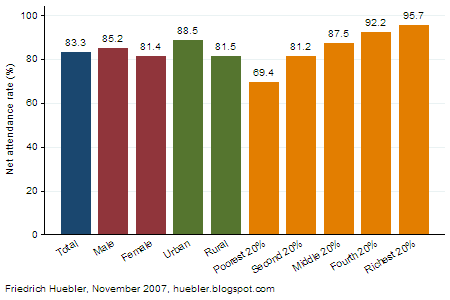
According to data from a nationally representative Demographic and Health Survey (DHS), the primary school net attendance rate (NAR) in India was 83 percent in 2006. (In India, the DHS is referred to as National Family Health Survey or NFHS.) In other words, more than 8 out of 10 children of primary school age (6-10 years in India) were attending primary school. In 2000, the primary school net attendance rate was 76 percent. Although the attendance rate has increased, there are persistent disparities in the education system of India. The bar graph below displays the primary school NAR by sex, area of residence, and household wealth. 85 percent of all boys and 81 percent of all girls are in school and the country is therefore close to gender parity. On the other hand, there is a larger gap between urban and rural areas. The urban primary NAR is 89 percent and the rural NAR is 82 percent.

Primary school net attendance rate (NAR), India 2006
Bar graph showing primary school net attendance rate in India in 2006
Data source: India Demographic and Health Survey 2005-06

Disaggregation by household wealth reveals even greater disparities. 96 percent of all primary-school-age children from the richest household quintile are in school. With declining household wealth, the share of children in school also falls. In the poorest household quintile, the primary NAR is only 69 percent, almost one third below the NAR in the richest households. As a consequence, children from the poorest households make up almost half of all children out of school in India. An earlier article on this site contains additional data on children out of school in India.

Note on NAR calculation

The official report for the India DHS lists the primary NAR as 71.9 percent (IIPS and Macro International 2007a, Table 2.8, page 31). The primary NAR cited above, 83.3 percent, is higher because of a different calculation method. The DHS report uses the traditional definition of the primary school net attendance rate, which only considers attendance in primary school and ignores attendance at higher levels of education.
  • Primary NAR (traditional definition) = Number of children of primary school age in primary school / Total number of children of primary school age
A joint report by UNESCO and UNICEF, Children out of school: Measuring exclusion from primary education (UNESCO Institute for Statistics 2005), introduced a revised method to calculate the primary NAR. In contrast to the traditional calculation method, school attendance at primary or higher levels of education is considered.
  • Primary NAR (revised definition) = Number of children of primary school age in primary school or higher / Total number of children of primary school age
In countries like India, where a relatively large number of children of primary school age are already in secondary school, the traditional calculation method underestimates the true level of participation in the education system and overestimates the number of children out of school. During an assessment of progress toward universal primary education, the primary NAR published in the final DHS report would lead to the wrong conclusion that almost 30 percent of all children of primary school age are not in school in India. In fact, fewer than 17 percent of all children of primary school age are not in school.

References
  • International Institute for Population Sciences (IIPS), and Macro International. 2007a. National Family Health Survey (NFHS-3) 2005-06, India: Volume 1. Mumbai: IIPS. (Download in PDF format, 7.9 MB)
  • International Institute for Population Sciences (IIPS), and Macro International. 2007b. National Family Health Survey (NFHS-3) 2005-06, India: Volume II. Mumbai: IIPS. (Download in PDF format, 4.1 MB)
  • UNESCO Institute for Statistics (UIS). 2005. Children out of school: Measuring exclusion from primary education. Montreal: UIS. (Download in PDF format, 4.9 MB)
Related articles
External links
Friedrich Huebler, 19 November 2007 (edited 12 October 2008), Creative Commons License
Permanent URL: http://huebler.blogspot.com/2007/11/primary-school-attendance-in-india-in.html

13 November 2007

India has 21 million children out of school

India is the country with the largest number of children out of school. India has more children of school age than China and at the same time relatively low attendance rates, in spite of recent increases in primary and secondary school participation.

Newly released data from a Demographic and Health Survey (DHS) show that the primary school attendance rate has increased by more than one percentage point annually since the beginning of the decade. In 2000, 76 percent of all children of primary school age (6-10 years) were in school. By 2006, this value had increased to 83 percent (see Table 1). The attendance rate of girls increased by 9 percent over the 2000-2006 period and the attendance rate of boys by 6 percent. School attendance rates also grew in urban and rural areas, and across all household wealth quintiles. However, close to 17 percent of all children of primary school age continue to be out of school.

Table 1: Children of primary school age in school (percent), India 2000 and 2006

2000 2006 Change 2000 to 2006
Male 79.2 85.2 5.9
Female 72.3 81.4 9.1
Urban 82.5 88.5 5.9
Rural 73.8 81.5 7.7
Poorest 20% 66.1 69.4 3.2
Second 20% 69.2 81.2 12.1
Middle 20% 78.8 87.5 8.7
Fourth 20% 82.1 92.2 10.1
Richest 20% 89.1 95.7 6.6
Total 75.9 83.3 7.5
Data sources: India Multiple Indicator Cluster Survey (MICS) 2000, India DHS 2005-06.

As a result of the increase in primary school attendance, the number of children out of school fell by almost one third from 30 million in 2000 to 21 million in 2006 (see Table 2). This pattern could be observed for boys and girls, and for residents of urban and rural areas. However, disaggregation by household wealth reveals that one group of children did not follow the nationwide trend. Among the poorest 20 percent of all households, the number of children out of school grew from 9.4 million in 2000 to 9.8 million in 2006. Although the primary school net attendance rate among children from the poorest households grew by 3 percentage points from 2000 to 2006 (see Table 1), this increase was not strong enough to keep pace with population growth in the poorest segment of the Indian population.

Table 2: Children of primary school age out of school (million), India 2000 and 2006

2000 2006 Change 2000 to 2006
Male 13.0 9.5 -3.5
Female 16.4 11.2 -5.2
Urban 5.0 3.7 -1.3
Rural 24.5 17.0 -7.5
Poorest 20% 9.4 9.8 0.5
Second 20% 8.5 5.3 -3.2
Middle 20% 5.2 3.1 -2.1
Fourth 20% 4.3 1.7 -2.6
Richest 20% 2.0 0.8 -1.3
Total 29.5 20.7 -8.7
Data sources: India MICS 2000, India DHS 2005-06.

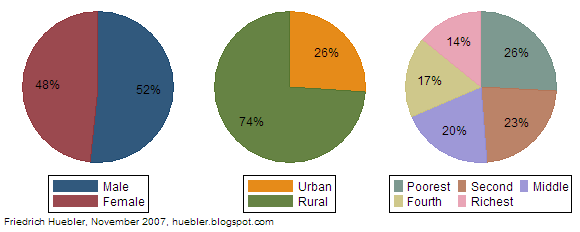
A comparison of the composition of the total population of primary school age and the population of children out of school shows which group of children are disproportionately more likely to miss out on education. Figure 1 shows the composition of the Indian population aged 6 to 10 years. 52 percent of all children in this age group are boys and 48 percent are girls. About one quarter of all children of primary school age live in urban areas and the remaining three quarters in rural areas.

Wealth quintiles are constructed by ranking the entire population of India, regardless of age, according to household wealth and dividing them into five equally sized groups with 20 percent each of the total population. As Figure 1 shows, households from poorer quintiles are more likely to have children than households from richer quintiles. Overall, 26 percent of all children between 6 and 10 years live in the bottom quintile and a further 23 percent in the second quintile.

Figure 1: Population of primary school age by sex, area of residence, and wealth quintile, India 2006
Pie charts showing composition of population of primary school age, India 2006
Data source: India Demographic and Health Survey 2005-06.

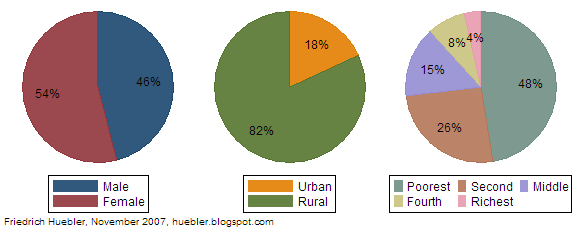
Figure 2: Children of primary school age out of school by sex, area of residence, and wealth quintile, India 2006
Pie charts showing composition of group of children of primary school age out of school, India 2006
Data source: India Demographic and Health Survey 2005-06.

Figure 2 shows the composition of the group of children aged 6 to 10 years that are out of school. Although girls only account for 48 percent of the total number of children in this age group, they make up 54 percent of the children out of school. Rural children are disproportionately more likely to be out of school than urban children. Most strikingly, children from the poorest quintile make up almost half of all children out of school. 48 percent - 10 million of the 21 million children out of school - live in the poorest quintile. 74 percent of all children out of school live in the two poorest quintiles.

These numbers emphasize the close link between poverty and school attendance in India. School attendance rates have increased among the poorest households between 2000 and 2006 but the increase was not large enough to keep pace with population growth. Unless India places more emphasis on school attendance among the poor, the country will miss the Millennium Development Goal of universal primary education by 2015.

Related articles
External links
Friedrich Huebler, 13 November 2007 (edited 12 October 2008), Creative Commons License
Permanent URL: http://huebler.blogspot.com/2007/11/india-has-21-million-children-out-of.html

18 October 2005

Primary school completion in India, 1950-2000

The share of the Indian population who attended school has increased steadily over the past 50 years. Data on educational attainment in India shows that about 80% of all persons born around 1990 have attended at least primary school. Of the generation born between 1950 and 1970, only about 55% ever attended school.

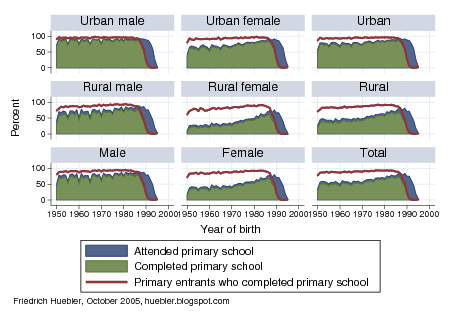
Not every child who enters primary school completes that level of education. High dropout rates are a particular concern in Sub-Saharan Africa, the region with the lowest school life expectancy values worldwide. In India, on the other hand, most children who enter the first grade stay in primary school until they graduate after five years of education. The graph below compares the percentage of Indians who attended primary school (independent of the number of years) with the percentage who completed primary education between 1950 and 2000. The data, from a 2000 Multiple Indicator Cluster Survey (MICS), is disaggegrated by sex and area of residence.

Primary school attendance and completion by year of birth, India 1950-2000
Chart with share of population who attended and completed primary education by year of birth, India 1950-2000
Data source: India 2000 MICS.

The population is grouped by year of birth and for each cohort three values are shown:
  • the percentage who attended primary school or higher (blue area)
  • the percentage who completed primary school (green area)
  • the percentage of primary entrants who completed primary school (ratio completed primary/attended primary, red line)
In urban areas, virtually all residents who attend primary school also complete that level of education. In rural India, completion rates are slightly lower but even here children typically stay in school until they graduate. 85% to 90% of primary school students born between 1950 and 1970 went on to graduate. Since 1970, this share has increased to more than 93% for India as a whole and in urban areas this value is as high as 97%. (The gap between primary school attendance and completion rates since 1990 is explained by the fact that children born since then were not old enough to have completed primary school at the time of the survey.)

The education system in India succeeds at keeping children in school. Children currently out of school are therefore likely to complete at least the primary level of education once they take the crucial step of enrolling in the first grade. A disaggregation of primary school attendance rates in India makes clear that many of the children out of school are girls from poor rural households. Educators and policy makers have to focus their efforts on this group of children to reach the Millennium Development Goal of universal primary education.

Related articles
Friedrich Huebler, 18 October 2005 (edited 12 October 2008), Creative Commons License
Permanent URL: http://huebler.blogspot.com/2005/10/primary-school-completion-in-india.html

10 October 2005

Educational attainment in India, 1950-2000

India is well on the way to achieving the Millennium Development Goal of universal primary education by the year 2015. In spite of rapid population growth during the last 50 years, India has managed to expand its education system to reach an ever larger part of the population.

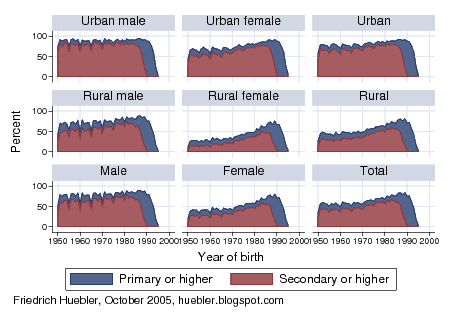
The increase in educational attainment since 1950 can be traced with data from a Multiple Indicator Cluster Survey (MICS) that was conducted in India in 2000. This nationally representative household survey collected data on the education of all household members aged 5 years or older. The data indicates whether a person attended school, at which level, and for how many years. By grouping all household members by year of birth we can calculate the percentage of a cohort that has attended - but not necessarily completed - a certain level of education. The graph below plots these values for all persons born between 1950 and 2000, disaggregated by sex and area of residence.

Educational attainment by year of birth, India 1950-2000
Chart with educational attainment (primary, secondary or higher) by year of birth, India 1950-2000
Data source: India 2000 MICS.

For each cohort two values are shown:
  • the percentage who attended primary school or higher (blue area)
  • the percentage who attended secondary school or higher (red area)
Until the 1970s, attendance rates for the population as a whole remained stable. About 55% of the population born between 1950 and 1970 attended primary school or higher. For persons born around 1990, this value has increased to roughly 80%.

School attendance rates were historically highest among urban males. Already in the 1950s, 90% of this group attended school at the primary level or higher. In contrast, the most disadvantaged group are women living in rural India. In the 1950s, only 25% of this group attended at least primary school. Women born since the 1970s are much more likely to benefit from education. The percentage of rural women who attended primary school or higher has increased from about 30% in the 1960s to about 70% in the 1990s.

Secondary school attendance rates have increased at a similar pace but at a lower lever. Most children who attend primary school continue their education at the secondary level. In 2000, the primary school net attendance rate in India overall was estimated to be 75% for boys and 69% for girls. The secondary school net attendance rate was estimated to be 54% for boys and 46% for girls. There has been much progress toward gender equality over the last 50 years but women and girls are still disadvantaged in Indian society.

Related articles
Friedrich Huebler, 10 October 2005 (edited 12 October 2008), Creative Commons License
Permanent URL: http://huebler.blogspot.com/2005/10/educational-attainment-in-india-1950.html

25 September 2005

Secondary school attendance in India

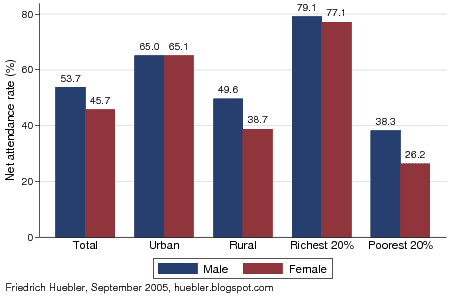
A Multiple Indicator Cluster Survey (MICS) that was conducted in India in 2000 showed that 72.1% of all children of primary school age (6-10 years) were attending primary school. (A previous post on this site has more details on primary school attendance in India.) Only two thirds of these children continue their education at the secondary level. Among children of secondary school age (11-17 years), 49.7% were in secondary school at the time of the MICS survey.

A comparison of primary and secondary school net attendance rates (NAR) reveals that virtually all primary school children from the richest 20% of all households go on to attend secondary school. For children from the poorest 20% of all households, the NAR drops from 64.0% at the primary level to 32.3% at the secondary level. Rural children are also much less likely to stay in school than urban children.

Secondary school net attendance rate, India 2000
Bar chart with male and female secondary school net attendance rate in India, 2000
Data source: India 2000 MICS.

The gender disparity that can be observed at the primary level is even more pronounced at the secondary level. The secondary school NAR among boys was 53.7%, compared to 45.7% for girls. A disaggregation of the data shows that this disparity at the country level is a consequence of gender discrimination in rural areas and among poor households. In urban areas and among the richest households, the gender parity index (GPI) - the ratio of female to male NAR - is at or close to 1. Rural girls and girls from the poorest household, on the other hand, are much less likely to attend secondary school than their male peers.

Secondary school net attendance rate, India 2000

Total
NAR (%)
Male NAR (%)Female NAR (%)Difference
male- female
GPI
female/ male
Urban65.165.065.1-0.11.00
Rural44.249.638.710.80.78
Richest 20%78.179.177.11.90.98
Poorest 20%32.338.326.212.00.69
Total49.753.745.78.00.85
GPI: gender parity index. - Data source: India 2000 MICS.

Friedrich Huebler, 25 September 2005 (edited 27 January 2007), Creative Commons License

29 August 2005

Primary school attendance in India

Today I will begin a series of posts that take a closer look at gender disparity in school attendance. Goal 3 of the Millennium Development Goals calls for the promotion of gender equality and the empowerment of women. The targets listed under this goal include the elimination of gender disparity in primary and secondary education, preferably by 2005, and at all levels of education no later than 2015.

Education statistics published by UNESCO are mostly based on administrative records of enrollment. Data from household surveys are an alternative source of statistics on school attendance. Because household surveys collect data on various characteristics of children and the households they live in it is possible to analyze gender disparity in more detail than with national enrollment data on primary or secondary education.

With household survey data a child is counted as being in school if one of the following two conditions is met:
  1. The child attended school during the week preceding the survey.
  2. The child was in school anytime during the year preceding the survey. This condition is added to account for children who were not in school because they were ill, because they were on vacation, or for other reasons.
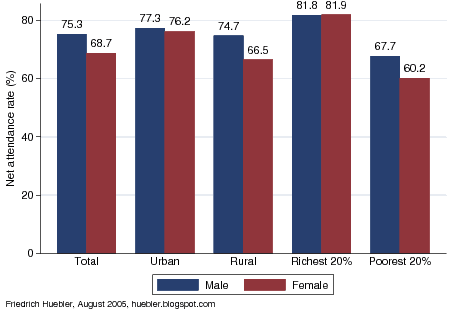
In India, one of the most recent surveys is a Multiple Indicator Cluster Survey (MICS) that was conducted in 2000. Overall, 72.1% of all children of primary school age (6-10 years) were attending primary school according to the data from the India MICS (see also the graph in a previous post). The graph below presents the primary school NAR for boys and girls disaggregated by the area of residence and by household wealth.

Primary school net attendance rate, India 2000
Bar chart with male and female primary school net attendance rate in India, 2000
Data source: India 2000 MICS.

In the country as a whole, more boys than girls go to primary school. The NAR of boys is 6.6% higher than the NAR of girls (see the table below). This gender disparity at the country level is clearly driven by the patterns of school attendance in rural areas and in poor households. In urban areas and among the richest 20% of the population, boys' and girls' attendance rates are virtually identical. Rural families and those from the poorest 20% of the population, on the other hand, are likely to send only boys to school when they cannot afford education for all their children. To reach the Millennium Development Goal of gender parity, policy makers have to focus their efforts on rural India and on households that suffer from poverty.

Primary school net attendance rate, India 2000

Total
NAR (%)
Male NAR (%)Female NAR (%)Difference
male- female
GPI
female/ male
Urban76.877.376.21.10.99
Rural70.774.766.58.20.89
Richest 20%81.981.881.9-0.11.00
Poorest 20%64.067.760.27.50.89
Total72.175.368.76.60.91
GPI: gender parity index. - Data source: India 2000 MICS.

Friedrich Huebler, 29 August 2005 (edited 27 January 2007), Creative Commons License.

22 August 2005

Education data from household surveys

Education statistics published by the UNESCO Institute for Statistics rely on two sources of data: (a) administrative records of enrollment that are provided by national governments and (b) population statistics from the United Nations Population Division. For example, the primary school net enrollment rate is calculated as follows:
  • Primary school NER = children of primary school age enrolled in primary school / total population of primary school age
The numerator uses national enrollment data and the denominator population data from the UN Population Division. This combination of data from two different sources can lead to errors in the calculation of indicators like the NER. Estimates by the UN Population Division may not match the actual population figures in a country. Local schools, whose records are aggregated at the national level, may misstate enrollment to obtain financing and governments may do the same to meet objectives like the Millennium Development Goals. A further limitation of education statistics based on administrative records is that they provide little information about the characteristics of students beyond age and sex. In spite of these concerns, the data published by UNESCO remains the most comprehensive collection of global education statistics.

Household surveys are an alternative source of data on education. Because survey data is collected at the household level, it is possible to capture a large amount of additional information on children and the households and communities they live in. In contrast to records of enrollment, household surveys also provide data on children out of school that can be analyzed to guide policies aimed at increasing school enrollment rates.

Estimates derived from surveys use a single source of data, which minimizes problems that arise from the combination of data from different sources. However, the estimates are affected by two other types of errors: sampling errors and nonsampling errors. Sampling errors arise because surveys cover only a part of the population and estimates are therefore not identical to those that would be obtained by surveying the entire population of a country. Nonsampling errors are the result of mistakes during data collection and data processing, for example incorrect responses by survey respondents and mistakes during data entry. Sampling errors can be minimized by selecting a sufficiently large sample and nonsampling errors can be minimized through training of survey staff.

Two household survey programs that focus on developing countries are the Demographic and Health Surveys (DHS) and the Multiple Indicator Cluster Surveys (MICS). The DHS were initiated by the U.S. Agency for International Development (USAID) in the 1980s to provide data on population and health trends. The MICS program was developed by UNICEF in the 1990s to monitor the situation of women and children.

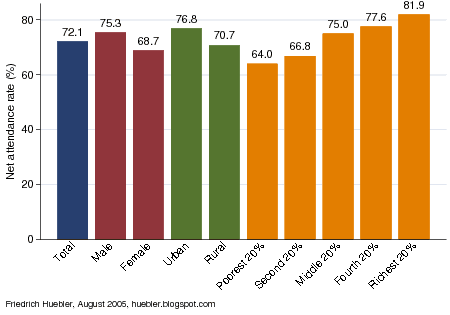
Both the DHS and the MICS collect data on school attendance. As an example I show estimates for the primary school net attendance rate (NAR) from the 2000 MICS in India. The primary school NAR is calculated as follows:
  • Primary school NAR = number of children of primary school age that are attending primary school / number of children of primary school age
Similar to the NER, the maximum value of the NAR is 100%. In the India MICS, 72.1% of all children of primary school age (6-10 years) were found to be in primary school. Attendance rates were higher among boys than girls (75.3% vs. 68.7%). NER data from UNESCO limits the analysis to a breakdown by sex but with survey data we can also analyze other disparities. In India, for example, urban children (NAR 76.8%) are more likely to attend primary school than rural children (NAR 70.7%). Household wealth is also an important determinant of school attendance. Among the poorest 20% of all households, only 64.0% of children attend primary school, compared to 81.9% of children from the richest 20% of all households.

Primary school net attendance rate, India 2000
Bar chart with primary school net attendance rate in India, 2000
Data source: India 2000 MICS.

In the coming weeks I will present more education data from household surveys. By providing detailed information on the determinants of school attendance at the household level, surveys are an important tool for policy makers and for researchers and organizations that work in the area of education.

Related articles
Friedrich Huebler, 22 August 2005 (edited 12 October 2008), Creative Commons License
Permanent URL: http://huebler.blogspot.com/2005/08/education-data-from-household-surveys.html
.