23 April 2005

Primary school gross and net enrollment

The primary school net enrollment ratio (NER) is the share of children of official primary school age that are enrolled in primary school; the NER cannot exceed 100%. The gross enrollment ratio (GER) is the share of children of any age that are enrolled in primary school. In countries where many children enter school late or repeat a grade the GER can exceed 100%.
  • NER = Enrolled children in the official school age group / Total number of children in the official school age group
  • GER = Enrolled children of all ages / Total number of children in the official school age group
If many children outside of the official primary school age range are enrolled in primary school, the GER can exceed the NER by a large margin. A comparison of primary school NER and GER can therefore indicate where delayed enrollment and grade repetition are most widespread. The following table lists the average NER and GER by region, as well as the difference between GER and NER and the ratio of GER over NER. The regional values are weighted by the population of primary school age in each country.

RegionPrimary school NER (%)Primary school GER (%)Difference GER-NERRatio
GER/NER
East Asia, Pacific92.0
110.9
18.9
1.21
Eastern and Southern Africa63.6
92.0
23.4
1.40
Eastern Europe, CIS87.6
99.7
8.2
1.10
Industrialized countries95.9
101.0
5.0
1.05
Latin America, Caribbean95.2
119.7
24.5
1.26
Middle East, North Africa80.6
91.4
10.5
1.14
South Asia81.4
94.1
14.4
1.18
West and Central Africa48.8
79.9
17.2
1.36
World84.1
99.9
16.0
1.20
Data source: UNESCO Institute for Statistics (UIS). 2004. Global Education Digest 2004. Montreal: UIS.

The blue circles in the graph below indicate the GER/NER ratio for each country. The red marks indicate the average GER/NER value in each region, listed in the table above, and the 95% confidence interval for this average.

Primary school gross and net enrollment ratios, 2001/2002
Graph showing ratio of primary school gross/net enrollment ratio by region
Data source: UNESCO Institute for Statistics (UIS). 2004. Global Education Digest 2004. Montreal: UIS.
Note: Red marks indicate the regional average of GER/NER and the 95% confidence interval.


West and Central Africa, and Eastern and Southern Africa stand out as the two regions with the highest GER/NER ratios, 1.40 and 1.36, respectively. Children in Sub-Saharan Africa often enter school late and stay at the primary level well past primary school age. Latin America and the Caribbean, and East Asia and the Pacific also have GER/NER values above the global average of 1.20, but at much higher net enrollment ratios than the countries of Sub-Saharan Africa.

Friedrich Huebler, 23 April 2005 (edited 24 April 2005), Creative Commons License

20 April 2005

Regional trends in secondary school enrollment

Trend data from UNESCO shows that the primary school net enrollment ratio (NER) has increased at the global level from 78% in 1980 to 88% in 2000. Secondary school enrollment has also increased, from 44% in 1980 to 67% in 2000 (see the graph below). In contrast to primary education, there has been virtually no gender disparity in secondary education since the 1980s. In 1980, the global secondary school NER of boys was 2% above that of girls but by 2000 the situation was reversed, with boys lagging behind girls by almost 2%.

An analysis of regional trends in secondary education is less reliable than a similar analysis at the primary level because of a lack of data. A previous post on secondary school enrollment made clear that for many countries in Africa and South Asia the secondary school NER is unknown. In East Asia, there is no data for China and in Eastern Europe, there is no data for Russia. For these regions, the trends presented below should therefore be interpreted with caution.

Secondary school net enrollment ratio, 1980-2000
Graph showing secondary school net enrollment rate between 1980 and 2000 for each UNICEF region
Data sources: UNESCO Institute for Statistics (UIS). 2004. Global Education Digest 2004. Montreal: UIS. - World Education Indicators, UNESCO Institute for Statistics, March 2005.

The regional groupings in the graph were adopted from UNICEF (see the map in a post on regional trends in primary school enrollment). Of all regions, Latin America and the Caribbean witnessed the strongest increase in secondary school enrollment; in 1980, the secondary school NER was 27% and in 2000 it was 63%. In the Middle East and North Africa and in South Asia, the countries for which UNESCO provides data managed not only to increase enrollment overall, they also reached gender parity in secondary education. As in primary education, Sub-Saharan Africa continues to lag behind the other regions.

Friedrich Huebler, 20 April 2005, Creative Commons License

09 April 2005

Gender disparity in secondary school

The Millennium Development Goals challenge all UN member states to "eliminate gender disparity in primary and secondary education, preferably by 2005, and in all levels of education no later than 2015." The current state of gender disparity can be assessed with data from the Global Education Digest 2004 from UNESCO, which has estimates for the male and female secondary school net enrollment ratio (NER) in 141 countries. This data was used to create the map below.

Gender disparity in secondary school: male-female net enrollment ratio, 2001/2002
Map of the world showing male-female disparity in secondary school net enrollment rate for each country
Data source: UNESCO Institute for Statistics (UIS). 2004. Global Education Digest 2004. Montreal: UIS.

Compared to primary education, girls are not as disadvantaged in secondary education. On the contrary, in many countries the enrollment of boys lags behind that of girls. This is the case in 29 of 34 countries in Latin America and in 32 of 34 industrialized countries. The opposite is true in West and Central Africa: in 11 of the 12 countries with data in this region, girls have lower enrollment rates than boys. (Regions follow the grouping used by UNICEF.) Overall, in 96 countries girls are favored and in 45 countries boys are favored.

In eight countries, the secondary school NER of girls is 10 percentage points or more above that of boys: Suriname (22% difference in NER), St. Lucia (18%), St. Kitts and Nevis (17%), Mongolia (13%), Dominican Republic and Namibia (12%), and the Philippines and St. Vincent and the Grenadines (10%). In eight other countries, the secondary school NER of boys is 10 percentage points or more above that of girls: Yemen (26% difference), Togo (19%); Benin, Equatorial Guinea, Iraq, and Tajikistan (14%); Guinea (11%), and Cambodia (10%). In 63 countries, the difference between the male and female NER is in the range ±3%.

Related articles
Friedrich Huebler, 9 April 2005 (edited 12 October 2008), Creative Commons License
Permanent URL: http://huebler.blogspot.com/2005/04/gender-disparity-in-secondary-school.html

07 April 2005

Guide to creating PNG images with Stata

The entry of 27 March 2005, on regional trends in primary school enrollment, contains a graph that shows how the primary school net enrollment ratio has changed between 1980 and 2000. As most graphs on this site, it was created with the Stata statistical package and saved in Portable Network Graphics (PNG) format. Stata can export graphs in PNG format but up to version 9.0 it was difficult to control the size of a saved image.

In Stata 8, graphs are drawn in a separate window and the size of an exported PNG image is identical to the size of the graph window. To create images of a specific size, for example 500 by 400 pixels, it is necessary to repeatedly resize the graph window, export the graph, and check the size of the PNG file with an image viewer.

With Stata 9.1, released on 15 September 2005, and later versions, it is possible to specify the size of graphs that are exported to PNG format with the width(#) and height(#) options (see Stata help for png_options). However, the method described in this article offers some advantages because it can create graphs that are antialiased.

The alternative method to create PNG files was suggested to me by Stata technical support: export the graph from Stata to a PostScript file and convert this file to a PNG image. The conversion from PostScript to PNG format can be done with a free software package called Ghostscript. By using Stata in combination with Ghostscript it is possible to automate the creation of PNG files that have specific dimensions and that are antialiased. The difference in image quality is shown in the two figures below.

PNG graph exported from Stata
Example for a PNG graph exported from Stata

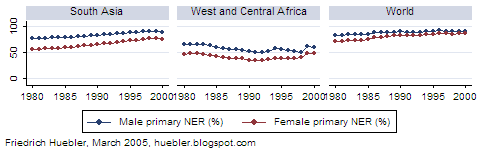
The graph above was directly exported from Stata in PNG format with the graph export command. The graph below was exported from Stata as a PostScript file and then converted to PNG format with Ghostscript. The quality of the text is better in the PNG file created by Stata. On the other hand, the trendlines in the image created by Ghostscript appear smoother because Ghostscript supports antialiasing.

PNG graph converted from PostScript format
Example for a PNG graph converted from PostScript format

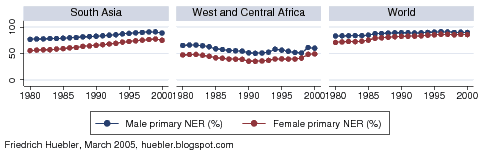
Ghostscript is released in two versions with different licences, as AFPL Ghostscript and GPL Ghostscript, but since July 2006 both versions are based on the same code. Download Ghostscript, install it on your computer, and identify the path to the Ghostscript executable. You can then adapt the Stata do-file below to create a PNG image. The example uses the auto dataset that is part of Stata to create a scatter plot with the dimensions 500 by 400 pixels.

Stata do-file to create a PNG graph with Ghostscript
* Load dataset
sysuse auto

* Set options for PostScript export
graph set ps pagesize custom
graph set ps pagewidth 5
graph set ps pageheight 4
graph set ps tmargin 0
graph set ps lmargin 0
graph set ps logo off
graph set ps fontface Helvetica

* Draw graph and export to PostScript file
scatter mpg weight, xsize(5) ysize(4)
graph export "scatter.ps"

* Convert PostScript file to PNG format
#delimit ;
shell "C:\Program Files\gs\gs8.56\bin\gswin32c.exe"
-dSAFER -dBATCH -dNOPAUSE
-r100 -g500x400 -sDEVICE=png16m
-dGraphicsAlphaBits=4 -dTextAlphaBits=4
-sOutputFile="scatter.png" "scatter.ps";
After the dataset is loaded, several options for exporting to PostScript are set. The width and height of the image are controlled with the pagewidth and pageheight options. Here, the options specify a graph 5 inches wide and 4 inches high. For an explanation of the other options type whelp ps_options in Stata.

The scatter command draws the graph. The width and height are again specified in inches, this time with the xsize and ysize options. The graph is then exported to a PostScript file.

Finally, Ghostscript is called with a shell command. At this point you have to enter the path to the Ghostscript executable on your computer. Identify the location of gswin32c.exe (by default, Ghostscript is installed in "C:\Program Files\gs\") and enter the full path in quotes following the shell command. The size of the graph is specified with the options -r100 (the resolution in pixels per inch) and -g500x400 (the dimensions of the PNG graph). The options -dGraphicsAlphaBits=4 and -dTextAlphaBits=4 control the antialiasing. The option -dGraphicsAlphaBits=2 sometimes works better because straight lines are less blurred; the PNG graph above was in fact created with -dGraphicsAlphaBits=2. The filename of the PNG graph is set with the -sOutputFile switch, and the filename of the PostScript source follows last.

The commands above were tested under Windows XP with GPL Ghostscript 8.56 and Stata versions 8.2, 9.2, and 10.

Related articles
External links
Friedrich Huebler, 7 April 2005 (edited 27 April 2008), Creative Commons License
Permanent URL: http://huebler.blogspot.com/2005/04/creating-png-images-with-stata.html

02 April 2005

Secondary school enrollment

International data on secondary school enrollment is available for fewer countries than data on primary school enrollment. The Global Education Digest 2004 from UNESCO has estimates for the secondary school net enrollment ratio (NER) in 147 countries. In contrast, the primary school NER is known for 174 countries. The secondary school NER is defined as the share of children of secondary school age that are currently enrolled in school.

The map below was created with data from the Global Education Digest 2004. The most recent estimates are for 2001/02. Of 51 countries with a secondary NER of 80% or higher, 32 are industrialized countries, seven are in Latin America and the Caribbean, and six are in Eastern Europe. Only six countries outside of these regions have secondary net enrollment ratios at a comparable level: Bahrain, Egypt, Jordan, and Palestine (NER 80 to 81%); Niue (94%); and the Seychelles (98%).

Secondary school net enrollment ratio, 2001/2002
Map of the world indicating secondary school net enrollment rate in each country
Data source: UNESCO Institute for Statistics (UIS). 2004. Global Education Digest 2004. Montreal: UIS.

For many countries in Africa and Asia, the secondary school NER is not known. However, the data for the remaining countries is not encouraging: fewer than four out of ten children have the opportunity to attend secondary school in large parts of Africa and South-East Asia. The lowest enrollment rates are reported for Niger (secondary school NER 6%); Chad, Burkina Faso, and Burundi (8%); Mozambique (11%); Madagascar and Guinea (12%); Uganda (14%); Mauritania and Ethiopia (15%); Djibouti (17%); and Liberia (18%).

A comparison with data on primary school enrollment makes clear that most children in South-East Asia at least attend primary school. Most African children have no formal education at all, not even at the primary level. In Latin America, most children attend primary school but fewer continue their education at the secondary level.

Friedrich Huebler, April 2005, Creative Commons License