Showing posts with label DHS. Show all posts

31 May 2015

Mean years of schooling in Nepal

On 25 April 2015, Nepal was struck by a severe earthquake that killed more than 8,800 people. Nepal is one of the world's poorest countries, with a gross national income (GNI) per capita of US$730 in 2013, similar to Afghanistan and Burkina Faso. Of 187 countries on the Human Development Index (HDI) 2014, Nepal was at position 145.

The rank of Nepal on the HDI is partly determined by the low level of education of its population. According to the Human Development Report 2014, the population 25 years and older of Nepal had on average 3.2 years of schooling in 2012.

This article takes a closer look at the level of education of the population of Nepal, based on an analysis of data from a 2011 Demographic and Health Survey (DHS). The DHS collected information on the highest grade of school completed for all household members 3 years and older, which can be used to calculate the years of schooling of individuals and the average years of schooling of the entire population or specific sub-groups. According to the DHS data, the population 25 years and older in Nepal has on average 3.3 years of schooling (Figure 1). The duration of primary education in Nepal is 5 years, which means that the average adult 25 years and older has less than completed primary education.

Urban residents have nearly twice as many years of schooling as rural residents, with 5.7 and 2.9 years respectively. There is a strong correlation between mean years of schooling and household wealth. Persons 25 years and older from the poorest household quintile have only 1.1 years of schooling on average, compared to 6.6 years in the richest quintile.

Figure 1: Mean years of schooling, population 25 years and older, Nepal 2011

Data source: Nepal Demographic and Health Survey, 2011.

Figure 1 also presents data for the development regions and ecological zones of Nepal. The country is administratively divided into five development regions (Far-Western, Mid-Western, Western, Central, and Eastern), 14 administrative zones, and 75 districts. The country is also divided into three ecological zones: Mountain, Hills and Terai. The development regions and ecological zones are shown in Figure 2. The epicenter of the April 2015 earthquake was in the Lamjung district in the Western development region. The capital Kathmandu, which was also severely affected by the earthquake, is in the Central development region.

The population in the Far-Western and Western development regions has 2.6 mean years of schooling, below the national average of 3.3 years. The population of the Western, Central and Eastern development regions is at or slightly above the national average. Residents of the Mountain zone have on average 2.2 years of schooling, while those in the Hill and Terai zone have 3.5 and 3.3 years, respectively.

Gender disparity in educational attainment affects all regions and sub-groups of the population in Figure 1. At the national level, women 25 years and older have only 2.2 years of schooling on average, compared to 4.6 years among men. There is a large gap between the mean years of schooling of men and women in both rural and urban areas of Nepal. Women from the poorest household quintile have only 0.5 mean years of schooling, less than any other group in Figure 1; men in the poorest quintile have 1.9 years of schooling. In the richest quintile, women have on average 6.2 years of schooling, compared to 8.1 years for men. Gender disparity is also present in all development regions and ecological zones.

Figure 2: Development regions, districts, and ecological zones of Nepal

Source: United Nations Nepal Information Platform, retrieved May 2015.

A comparison of different age groups reveals that in spite of the low average years of schooling Nepal has made impressive progress over the past decades. Younger cohorts have without exception more years of schooling than older cohorts (Figure 3). 20- to 24-year-olds have on average 6.9 years of schooling, compared to less than 1 year of schooling among those 65 years and older. In rural areas those 20-24 years old have on average 6.5 years of schooling and those in urban areas 8.5 years. The poorest residents of Nepal are still very much behind those from wealthier segments of the population but even here there has been an improvement among younger generations. 20- to 24-year-olds from the poorest quintile have on average 3.6 years of schooling. In the richest quintile, those aged 20-24 years have 9.6 years of schooling on average, more than any other group in Figure 3.

Figure 3: Mean years of schooling by age group, Nepal 2011

Data source: Nepal Demographic and Health Survey, 2011.

The disparity between women and men in younger cohorts is also far smaller than among older cohorts. Figure 4 shows two indicators of gender disparity. The difference between the mean years of schooling of men and women is plotted against the left vertical axis. Nationwide, 20- to 24-year-old women have on average 1.9 fewer years of schooling than men in the same age group.The biggest absolute gap is observed in the poorest household quintile; here, women 20-24 years have on average 2.8 fewer years of schooling than men. The smallest difference between male and female years of schooling, 0.7 years, is observed among 20- to 24-year-olds in the richest quintile.

A second indicator of gender disparity, female mean years of schooling as a percentage of male mean years of schooling, is plotted against the right vertical axis of Figure 4. At gender parity, this value is around 100%. In all groups in Figure 4, younger women are approaching the average years of schooling of men in the same age group. In Nepal as a whole, 20- to 24-year-old women have on average 76% of the years of schooling of their male peers. In the richest quintile, the youngest women have reached 93% of the years of schooling of men in the same age group. By contrast, young women from the poorest household quintile have only half the years of schooling of young men.

Over time, the increasing educational attainment among younger age groups will be reflected in the mean years of schooling of the entire population 25 years and older. Similarly, the gap between men and women will shrink. However, those in poor households and residents of certain regions - especially the Far-Western and Mid-Western region and the mountain zone - are lagging behind other parts of Nepal.

Figure 4: Gender disparity in mean years of schooling by age group, Nepal 2011

Data source: Nepal Demographic and Health Survey, 2011.

External links

Related articles

Friedrich Huebler, 31 May 2015, Creative Commons License
Permanent URL: http://huebler.blogspot.com/2015/05/nepal.html

31 January 2014

Mean years of schooling in Burkina Faso

In Burkina Faso, the population aged 25 years and older had on average 0.9 years of education in 2007, less than any other country for which the UNESCO Institute for Statistics (UIS) released estimates of mean years of schooling in December 2013.

The educational attainment of different age cohorts in Burkina Faso can also be examined with data from a Demographic and Health Survey (DHS) conducted in 2010. On average, persons aged 25 years and older in the DHS sample attended school for 1.4 years, slightly more than in the UIS data from 2007. The DHS data show a significant gender gap, with men having on average nearly twice as many years of schooling as women (1.9 years versus 1 year).

However, the disparity between men and women in Burkina Faso is not nearly as large as the disparity between the urban and rural population. In urban areas, the average number of years of education is 4.1 years, compared to 0.5 years in rural areas. Urban women have 11 times as many years of schooling as rural women (3.3 years versus 0.3 years). For men, mean years of schooling is 5.0 in urban areas and 0.7 in rural areas.

Mean years of schooling of the population 25 years and older, Burkina Faso, 2010
Total Male Female
Total 1.4 1.9 1.0
Urban 4.1 5.0 3.3
Rural 0.5 0.7 0.3
Source: Burkina Faso Demographic and Health Survey 2010.

The DHS data can also be used to compare the educational attainment of different age groups. The figure below visualizes mean years of schooling by five-year age group, from persons aged 20-24 years to those aged 70-74 years and 75 years and older. The graph is divided into nine segments with data for the total, male and female population of Burkina Faso, as well as the total, male and female population of urban and rural areas of the country. The blue line in each segment indicates the mean years of schooling by age group for the respective population group. In addition, each segment of the graph shows the lines for the other eight segments in light gray to make it easier to compare the data for the different groups.

One common feature across all population groups is that younger generations have more formal schooling than older generations, reflecting an expansion of access to education over time. In the total population, mean years of schooling increased from 0.1 years among those 75 years and older to 2.9 years among 20- to 24-year-olds. The biggest growth is observed among urban men: for this group, mean years of schooling is 0.8 years in the oldest cohort and 7.2 years among those aged 20-24 years. Rural women have traditionally been least likely to attend school but even here there is an upward trend: rural women 75 years and older have on average 0 years of schooling whereas rural women aged 20-24 years have on average 0.9 years of schooling.

In conclusion, although the average level of education in Burkina Faso is very low, the situation is improving over time because children are more likely to attend school today than in previous decades. At the same time, the population of rural areas continues to be at a distinct disadvantage and lack of access to education is especially widespread among rural women.

Mean years of schooling by five-year age group, Burkina Faso, 2010 (click image to enlarge)

Source: Burkina Faso Demographic and Health Survey 2010.

External links

Related articles

Friedrich Huebler, 31 January 2014 (edited 4 February 2014), Creative Commons License
Permanent URL: http://huebler.blogspot.com/2014/01/mys.html

30 April 2012

School attendance among 5- to 24-year-olds in Liberia

An article that was published on this site in July 2011, "School attendance by grade and age in Liberia", shows that overage school attendance is very common in Liberia, mainly due to late entry into the education system. The official primary school age in Liberia is 6 to 11 years according to the International Standard Classification of Education (ISCED). Yet, an analysis of data from a Demographic and Health Survey (DHS) from 2007 demonstrates that the vast majority of pupils in primary and secondary school in Liberia are older than the theoretical age for their grade. For example, nearly three quarters of all first-graders in Liberia are at least 3 years older than the official entrance age into primary education (see Figure 1). 24% of all first-graders are 5 or 6 years overage, 14% are 7 or 8 years overage, and 5% are 9 or more years overage. Children in the last group start primary school at age 15 or later.

Figure 1: Age distribution of pupils in primary and secondary education in Liberia, 2007
Graph with data on overage and underage pupils in primary and secondary education in Liberia
Source: Demographic and Health Survey (DHS) 2007. - Click image to enlarge.

Figure 1 shows the age distribution in the 12 grades of primary and secondary education in Liberia. The same DHS data from 2007 can also be analyzed differently, by single year of age instead of by grade. Figure 2 presents the level and grade attended for the population between 5 and 24 years of age. For each age group, the graph shows the percentage in pre-primary, primary, secondary, and tertiary education. The data for primary and secondary education is further divided into single grades, indicated by shades of blue for the 6 primary grades and shades of green for the 6 secondary grades. In addition, Figure 2 shows how many percent are out of school and for how many percent the level and grade of education attended is missing.

Figure 2: Level and grade of education attended by population 5-24 years in Liberia, 2007
Graph with data on school attendance by age in Liberia
Source: Demographic and Health Survey (DHS) 2007. - Click image to enlarge.

One surprising finding is the large percentage of children between 5 and 14 years who are in pre-primary education. About half of all 5- to 8-year-olds, 39% of all 9-year-olds, and 28% of all 10-year-olds are in pre-primary education. Even at age 14, nearly 7% are still in preschool. One possible explanation is that parents keep their children in pre-primary education due to lack of access to primary education.

Some children start attending primary education at age 5 or 6 but most children enter late. Even among persons 20 years or older, some are still in the first primary grade. School attendance overall reaches a peak at age 14, when more than 86% are in school, mostly in primary education. Primary school attendance rates are highest among 12- to 15-year-olds; two out of three children in this age group are in primary education. Secondary school attendance reaches a peak at age 19, when 38% are in secondary education; in addition, at least 30% of all 17- and 18-year-olds are in secondary education. Attendance rates for tertiary education are low and do not exceed 2% until age 24, when 4% study at a university or other institution of higher learning.

The percentage of the population that is not in any type of formal education decreases from 44% among 5-year-olds to 13% among 14-year-olds. From age 15, out-of-school rates increase again and among 23- and 24-year-olds in Liberia, 61% and 60%, respectively, are not in school. Lastly, for a small percentage of the DHS sample, the grade and level attended was missing.

Related articles

External links

Friedrich Huebler, 30 April 2012, Creative Commons License
Permanent URL: http://huebler.blogspot.com/2012/04/liberia.html

31 July 2011

School attendance by grade and age in Liberia

The article "Overage pupils in primary and secondary education" of June 2011 summarized data on school attendance from 36 countries and found that overage school attendance is common in sub-Saharan Africa. The countries with the highest share of overage pupils in the sample were Haiti, Liberia, Uganda, Rwanda, Cambodia, Ethiopia, Ghana, Madagascar, and Malawi. In Liberia, 93% of all pupils in primary and secondary education are at least one year overage for their grade and 84% are at least two years overage. This article takes a closer look at Liberia by analyzing data from the same Demographic and Health Survey (DHS) from 2007 that was analyzed for the earlier article.

The official primary school age in Liberia, as defined by the International Standard Classification of Education (ISCED), is 6 to 11 years. The official secondary school age is 12 to 17 years. Given these school ages, a 6-year-old in grade 1 and a 7-year-old in grade 2 are in the right grade for their age. A 7-year-old in grade 1 would be one year overage and an 8-year-old in grade 1 would be two years overage. A 5-year-old in grade 1 would be one year underage.

The graph below shows the age distribution of pupils in primary and secondary education in Liberia. Pupils who are in the right grade for their age or underage are in a small minority. In the first twelve grades, their share never exceeds 9%. By contrast, as many as 98% of all pupils in a single grade are overage. The degree of overage attendance is astounding: 5% of all first graders are 9 or more years overage, meaning that they start primary school at age 15 or later. 19% of all first graders are at least 7 years overage and 44% are at least 5 years overage. In grade 8, 18% of all pupils are 9 or more years overage; while the official age for eighth graders is 13 years, one in five pupils in that grade in Liberia is 22 years or older.

Age distribution of pupils in primary and secondary education in Liberia, 2007
Graph with data on overage and underage pupils in primary and secondary education in Liberia
Source: Demographic and Health Survey (DHS) 2007. - Click image to enlarge.

What are the reasons for this high prevalence of overage school attendance? In Liberia, as in other countries of sub-Saharan Africa, many pupils enter school late for a variety of reasons that include poverty, a scarcity of educational facilities, and lack of enforcement of the official school ages. High repetition rates further exacerbate the problem of overage school attendance. Among the consequences of this age structure in school are a higher probability of dropout and reduced lifetime earnings caused by incomplete education or late entry into the labor market.

Related articles
External links
Friedrich Huebler, 31 July 2011 (edited 27 February 2012), Creative Commons License
Permanent URL: http://huebler.blogspot.com/2011/07/liberia.html

30 June 2011

Overage pupils in primary and secondary education

Pupils can be overage for their grade for two reasons: late entry and repetition. Take for example a country where children are expected to enter primary school at 6 years of age. If a child enters grade 1 at age 7, he or she is one year overage for the grade. A child who enters grade 1 at age 8 and repeats the grade will be three years overage for the grade; two of the three years are due to late entry and the third year is due to repetition.

Children who are many years overage are less likely to complete their education. If they stay in school, they graduate later than pupils who entered school at the official starting age. These overage graduates enter the labor market late and often with lower educational attainment. As a consequence, they are likely to have lower cumulative earnings over their lifetime than persons who graduated and entered the labor market at a younger age and with higher educational attainment. For the country as a whole this in turn means reduced national income and slower economic growth.

Overage school attendance is common in sub-Saharan Africa but also occurs in other regions. The figure below shows data from 36 nationally representative household surveys that were conducted between 2004 and 2009. 34 of these surveys were Demographic and Health Surveys (DHS) and the remaining two surveys, those for Bangladesh and Kyrgyzstan, were Multiple Indicator Cluster Surveys (MICS). For each country, the graph shows the share of children in primary and secondary education who are at least one or two years overage for their grade. The entrance ages and durations of primary and secondary education used in this study are those specified by the International Standard Classification of Education (ISCED).

Percentage of children in primary and secondary education who are at least 1 or 2 years overage for their grade
Graph with data on overage children in primary and secondary education
Source: Demographic and Health Surveys (DHS) and Multiple Indicator Cluster Surveys (MICS), 2004-2009.

In the sample of 36 countries, the share of children who are at least one year overage for their grade ranges from 5 percent in Armenia to 95 percent in Haiti. Other countries where at least three out of four pupils in primary or secondary education are overage include Liberia (93%), Uganda (86%), Rwanda (83%), Cambodia (78%), Mozambique (76%), and Ethiopia (75%). In addition to Armenia, the percentage of pupils who are at least one year overage is below 10 percent in Moldova and Egypt (8%).

The share of children in primary and secondary education who are at least two years overage for their grade ranges from 1 percent in Armenia to 85 percent in Haiti. In addition to Haiti, at least half of all pupils are two or more years overage in Liberia (84%), Uganda (67%), Rwanda (65%), Ethiopia (59%), Cambodia (55%), Malawi (51%), and Madagascar (50%). On average, the share of children who are at least two years overage is 19 percent less than the share of children who are at least one year overage.

However, there are exceptions. In Albania and the Ukraine, 43 and 26 percent respectively of all children in primary and secondary education are at least one year overage. By contrast, only 5 and 2 percent respectively are at least two years overage. This means that in these two countries, a relatively large number of children enter school one year late or repeat one grade, but hardly any children enter school two years late or repeat more than one grade. Late entry and repetition are therefore less likely to have negative consequences on lifetime earnings and national income in Albania and the Ukraine than in other countries.

Related articles External links
Friedrich Huebler, 30 June 2011, Creative Commons License
Permanent URL: http://huebler.blogspot.com/2011/06/age.html

30 April 2010

Age distribution by wealth quintile in household survey data

Household survey data may not contain precise ages for all household members. Age heaping, an unusually high share of ages ending in 0 and 5, is especially common in survey data from developing countries. Age heaping can be caused by uncertainty of survey respondents about their own age or the age of other household members, intentional misreporting, or errors during data collection and processing. Errors in age data can affect the estimation of education indicators from household survey data because these indicators are often calculated for specific age groups. Examples include the youth literacy rate and school attendance rates for the population of primary and secondary school age.

An article on age distribution in household survey data on this site demonstrated age heaping in survey data from India, Nigeria and to a lesser extent Indonesia. Data for Brazil showed little to no age heaping. To investigate whether age heaping is more common among certain segments of the population, the survey samples can be disaggregated by household wealth quintile. For this purpose, the households in the sample are first ranked by wealth, from poorest to richest. The population is then divided into five equally sized groups with 20 percent each of all household members in the sample.

Figure 1 shows the age distribution by single year of age and wealth quintile in data from Brazil. The data were collected in 2006 with a Pesquisa Nacional por Amostra de Domicílios (PNAD) or National Household Sample Survey. No preference for ages ending in 0 and 5 could be observed for the entire survey sample combined and disaggregation does not change the result. The age distribution in each quintile is smooth, with no peaks at ages ending in 0 and 5. The only obvious difference between the population in the different quintiles is that poorer families tend to have more children, indicated by a peak in the age distribution in the younger age groups.

Figure 1: Age distribution in household survey data by single-year age group and household wealth quintile, Brazil
Line graph with age distribution in survey data from Brazil by single-year age group and household wealth quintile
Data source: Brazil PNAD 2006.

Figure 2 shows the age distribution in Demographic and Health Survey (DHS) data from India. The data were collected in 2005-06. In contrast to Brazil, there is considerable age heaping in the Indian data. However, peaks around ages ending in 0 and 5 are more pronounced among poorer households. Increasing household wealth is associated with a decrease in age heaping.

Figure 2: Age distribution in household survey data by single-year age group and household wealth quintile, India
Line graph with age distribution in survey data from India by single-year age group and household wealth quintile
Data source: India DHS 2005-06.

Data from Indonesia, collected with a Demographic and Health Survey in 2007, are shown in Figure 3. At the aggregate level, the survey data from Indonesia exhibit little age heaping. However, disaggregation by wealth quintile reveals that reported ages ending in 0 and 5 are more common among poorer households.

Figure 3: Age distribution in household survey data by single-year age group and household wealth quintile, Indonesia
Line graph with age distribution in survey data from Indonesia by single-year age group and household wealth quintile
Data source: Indonesia DHS 2007.

Finally, Figure 4 displays data from a 2008 Demographic and Health Survey in Nigeria. Similar to India, there is a high percentage of ages ending in 0 and 5 in the combined survey sample. The disaggregated data show that age heaping occurs more frequently among poorer households but also exists in the richest wealth quintile.

Figure 4: Age distribution in household survey data by single-year age group and household wealth quintile, Nigeria
Line graph with age distribution in survey data from Nigeria by single-year age group and household wealth quintile
Data source: Nigeria DHS 2008.

Disaggregation of household survey data from Brazil, India, Indonesia and Nigeria has shown that age heaping occurs more frequently in data collected from poorer households. Wealthier households may have more access to birth registration and therefore may be able to verify their ages with birth certificates. Wealthier households are also likely to be smaller and survey respondents would therefore have to know and report the ages of fewer persons than respondents from larger households.

Age heaping in survey data reduces the accuracy of education indicators that are calculated for single years of age, for example for all children of primary school entrance or graduation age. However, indicator estimates for larger age groups, for example all children of primary or secondary school age, are less likely to be affected by errors in age data.

Related articles
External links
Friedrich Huebler, 30 April 2010, Creative Commons License
Permanent URL: http://huebler.blogspot.com/2010/04/age.html

28 February 2010

Age distribution in household survey data

Indicators in the field of education statistics, such as those defined in the education glossary of the UNESCO Institute for Statistics, are typically calculated for specific age groups. For example, the youth literacy rate is for the population age 15 to 24 years, the adult literacy rate for the population age 15 and over, and the net attendance rates for primary and secondary education are for the population of primary and secondary school age, respectively. The net intake rate is an example for an indicator that is calculated for a single year of age, the official start age of primary school.

For a correct calculation of education indicators it is necessary to have precise age data. In the case of data collected with population censuses or household surveys this means that the ages recorded for each household member should be without error. However, census or survey data sometimes exhibit the phenomenon of age heaping, usually on ages ending in 0 and 5. Such heaping or digit preference occurs when survey respondents don't know their own age or the ages of other household members, or when ages are intentionally misreported.

The presence of age heaping can be tested with indices of age preference such as Whipple's index. Heaping can also be detected through visual inspection of the age distribution in household survey data. Figures 1 and 2 summarize the age distribution in survey data from Brazil, India, Indonesia and Nigeria. The data from Brazil were collected with a Pesquisa Nacional por Amostra de Domicílios or National Household Sample Survey in 2006. The data for the other three countries are from Demographic and Health Surveys conducted between 2005 and 2008.

Figure 1 shows the share of single years of age in the total survey sample. A preference for ages ending in 0 and 5 is strikingly obvious in the data from India and Nigeria. In the data from Indonesia, age heaping is also present, but to a lesser extent than for India and Nigeria. Lastly, the graph for Brazil is relatively smooth, indicating a near absence of age heaping.

Figure 1: Age distribution in survey data by single-year age group
Line graph with age distribution in survey data by single-year age group
Data source: Brazil PNAD 2006, India DHS 2005-06, Indonesia DHS 2007, Nigeria DHS 2008.

In Figure 2, single ages are combined in five-year age groups, from 0-4 years and 5-9 years to 90-94 years and 95 years and over. Compared to Figure 1, the distribution lines are much smoother, including for India and Nigeria. We can conclude that age heaping is problematic for education indicators that are calculated for single years, for example all children of primary school entrance age, but less so for indicators that are calculated for a larger age group, for example all children of primary or secondary school age or all persons over 15 years of age.

Figure 2: Age distribution in survey data by five-year age group
Line graph with age distribution in survey data by five-year age group
Data source: Brazil PNAD 2006, India DHS 2005-06, Indonesia DHS 2007, Nigeria DHS 2008.

Related articles
External links
Friedrich Huebler, 28 February 2010 (edited 30 September 2010), Creative Commons License
Permanent URL: http://huebler.blogspot.com/2010/02/age.html

31 January 2010

EFA Global Monitoring Report 2010

Cover of the EFA Global Monitoring Report 2010The Education for All Global Monitoring Report 2010 was released on 19 January 2010. The Global Monitoring Report is written annually by an independent team and published by UNESCO.

The title of this year's report is Reaching the marginalized. UNESCO estimates that 72 million children of primary school age were out of school in 2007. The report examines who these children are and why they are excluded from education. The report further argues that there is a persistent financing gap that prevents countries from reaching the goal of education for all and that, based on current trends, 56 million children of primary school age will still be out of school in 2015.

The report introduces a new database on Deprivation and Marginalization in Education that was developed by the EFA Global Monitoring Report team and the Department of Economics at the University of Göttingen. The DME database introduces a measure of "education poverty", defined as the share of the population aged 17 to 22 years with less than 4 years or less than 2 years in school. Data are presented as global snapshots and in individual country profiles. All statistics were calculated with data from Demographic and Health Surveys (DHS) and Multiple Indicator Cluster Surveys (MICS).

Excerpt from Nigeria country overview in DME database
Graph with education disparity data from Nigeria
Source: Deprivation and Marginalization in Education database, country overviews.

Reference
  • UNESCO. 2010. EFA Global Monitoring Report 2010: Reaching the marginalized. Paris: UNESCO. (Download in PDF format, 12 MB)
External links
Related articles
Friedrich Huebler, 31 January 2010 (edited 7 March 2011), Creative Commons License
Permanent URL: http://huebler.blogspot.com/2010/01/gmr.html

30 December 2009

MICS Compiler by UNICEF

MICS Compiler, a new website by UNICEF, provides easy access to data from Multiple Indicator Cluster Surveys (MICS), nationally representative household surveys that are carried out with support from UNICEF. The site is similar to STATcompiler, which offers data from Demographic and Health Surveys (DHS).

MICS Compiler was launched with data from 26 surveys conducted in Africa, Asia, Eastern Europe, and Latin America and the Caribbean between 2005 and 2007. Estimates are available for 39 indicators in ten areas.
  1. Survey information
  2. Child mortality
  3. Nutrition
  4. Child health
  5. Environment
  6. Reproductive health
  7. Child development
  8. Education
  9. Child protection
  10. HIV/AIDS, sexual behavior, and orphaned and vulnerable children
Access to the data requires two steps. In the first step, users of MICS Compiler must select one or more surveys. In the second step, the indicators are selected. The results are presented in tables or graphs. As an example, the screenshot below shows a graph with the female youth literacy rate in 21 countries.

MICS Compiler by UNICEF: Female youth literacy rate in 21 countries, 2005-2006
MICS Compiler screenshot with female youth literacy rate

At present, the female youth literacy rate is the only indicator listed in the area of education but the MICS for All blog has announced plans to expand MICS Compiler with data for more indicators and more surveys. There are also plans for adding a mapping function, similar to the DHS STATmapper.

Related articles
External links
Friedrich Huebler, 30 December 2009, Creative Commons License
Permanent URL: http://huebler.blogspot.com/2009/12/mics.html

01 November 2008

Education disparity trends in South Asia

An article on education disparity in South Asia described a newly developed Education Parity Index (EPI). This index combines data on primary school attendance, secondary school attendance and the survival rate to the last grade of primary school, disaggregated by gender, area of residence and household wealth. The value of the EPI has a theoretical range of 0 to 1, where 1 indicates absolute parity.

Through a combination of survey data from several years it is possible to analyze trends in disparity as measured by the EPI. For the trend analysis, data from the following South Asian household surveys - mainly Demographic and Health Surveys (DHS) and Multiple Indicator Cluster Surveys (MICS) - were available.
  • Afghanistan: 2003 MICS
  • Bangladesh: 1999-2000 DHS, 2004 DHS, 2006 DHS
  • India: 1998-99 DHS, 2000 MICS, 2005-06 DHS
  • Nepal: 1996 DHS, 2000 MICS, 2001 DHS, 2006 DHS
  • Pakistan: 2000-01 survey, 2006-07 DHS
The graph below plots the EPI values calculated from each survey. Due to a lack of data, no trends can be shown for Afghanistan.

Education disparity trends in South Asia, 1996-2007
Trend lines with Education Parity Index values between 1996 and 2007
Data source: Demographic and Health Surveys (DHS), Multiple Indicator Cluster Surveys (MICS), 1996-2007.

In Bangladesh, India and Nepal, the EPI has increased from the earliest to the latest year with data, indicating a decrease in disparity over the period of observation. In Bangladesh, the EPI grew from 0.79 in 2000 to 0.84 in 2006. In India, the EPI was at 0.77 in 1999 and 0.82 in 2006. In Nepal, the EPI shows the biggest increase, from 0.67 in 1996 to 0.83 in 2006, interrupted by a decrease from 2000 to 2001. Compared to the other countries, Nepal has thus made the most progress toward parity in the education system.

For Pakistan, the EPI has decreased from 2000 to 2007, indicating an increase in disparity. However, an inspection of the underlying data reveals that the earlier survey did not provide data on household wealth. Disparities related to wealth are usually greater than disparities related to gender or area of residence. If data on wealth had been available, the EPI for 2000 would most likely have been lower. The data from the 2006-07 DHS confirm this assumption. Children from the poorest quintile have much lower attendance and survival rates than children from the richest quintile, and the disparity between these two groups of children is much greater than the disparity between boys and girls and between children from urban and rural households. For example, the primary school net attendance rate (NAR) in Pakistan is 46 percent among children from the poorest household quintile but twice as high, 93 percent, among children from the richest quintile. In comparison, the primary NAR is 76 percent for boys, 67 percent for girls, 82 percent for urban children, and 67 percent for rural children according to the 2006-07 DHS.

The data gaps in the graph bring to attention one limitation of the EPI. The net enrollment rate and other data published annually by UNESCO in the Global Education Digest or the Education For All Global Monitoring Report are not disaggregated beyond gender and can therefore not be used to calculate the EPI. On the other hand, national household survey data, which permit the required level of disaggregation, are not collected every year but only every four or five years, on average.

Related articles
External links
Friedrich Huebler, 1 November 2008 (edited 22 November 2008), Creative Commons License
Permanent URL: http://huebler.blogspot.com/2008/11/south-asia.html

05 October 2008

Child labor and school attendance

A previous article on child labor on this site presented a definition of child labor that considers both economic activity and household chores. The inclusion of household chores leads to a more precise measure of the burden of work on children. In particular, this new child labor indicator is less biased against girls, who typically spend more time on household chores and less time on economic activity than boys.

In the graph below, the proposed child labor indicator is used to evaluate the trade-off between child labor and school attendance among children aged 7 to 14 years in 35 developing countries. This age group was selected because in all 35 countries children are expected to enter primary school by age 7. The underlying data were collected with 26 Multiple Indicator Cluster Surveys (MICS) and 9 Demographic and Health Surveys (DHS) between 1999 and 2005. 34 of the surveys are nationally representative and one, Palestinians in Syria, is a subnational sample. Surveys conducted during school vacation were excluded from the analysis. The results therefore show the trade-off between child labor and school attendance during a time of the year when children are supposed to be in school.

School attendance refers to attendance of any type of school and not only schools that are part of the formal system of education. In addition, children of secondary school age who are still in primary school are also counted as attending school for the purpose of the present analysis. In contrast, such overage children are counted as out of school when indicators like the secondary school net attendance rate (NAR) are calculated. In a further simplification, child labor is defined for all ages as at least one hour of economic activity or 28 or more hours of household chores per week.

Child labor and school attendance, children 7-14 years
Scatter plot with child labor and school attendance rates in 35 countries
Data source: Demographic and Health Surveys (DHS), Multiple Indicator Cluster Surveys (MICS), 1999-2005.

The scatter plot above demonstrates the trade-off between child labor and school attendance. Countries with low child labor rates typically have high school attendance rates and vice versa. A linear regression shows that a 10 point increase in child labor is associated with a 7.6 point decrease in school attendance at the national level.

On average across the 35 countries in the sample, 77 percent of 7- to 14-year-olds attended school at the time of they survey. In ten countries, at least 90 percent of children were in school. In seven countries - Central African Republic, Chad, Guinea-Bissau, Mali, Niger, Sierra Leone, and Somalia - less than half of all children went to school. Somalia has by far the lowest attendance rate with 19 percent.

25 percent of all children between 7 and 14 years were engaged in child labor, ranging from 4 percent among Palestinians in Syria to 78 percent in Niger and Sierra Leone. In six countries, more than half of all children in this age group were child laborers: Central African Republic, Chad, Guinea-Bissau, Niger, Sierra Leone, and Uganda.

Related articlesExternal links
Friedrich Huebler, 5 October 2008, Creative Commons License
Permanent URL: http://huebler.blogspot.com/2008/10/child-labor.html

07 September 2008

Child labor: economic activity and household chores

Child labor is one of the obstacles on the way to the Millennium Development Goal of universal primary education by 2015. In a report on global child labor trends, the International Labour Organization (ILO) estimates that there are 218 million child laborers worldwide. 126 million of these children are estimated to be engaged in hazardous work (ILO 2006). The concept of child labor used by the ILO is derived from two conventions: ILO Convention 138, which sets 15 years as the general minimum age for employment, and ILO Convention 182 on the worst forms of child labor. Any work in violation of Conventions 138 and 182 is considered illegal child labor that should be eliminated.

One limitation of statistics like those published by the ILO is that they only refer to economic activity, that is work related to the production of goods and services, as defined in the United Nations System of National Accounts (UNSD 2001). This definition excludes chores undertaken in a person's own household like cooking, cleaning or caring for children.

Statistics of child labor that ignore household chores are problematic because they underestimate the burden of work on children, especially for girls. To examine the relative burden of economic activities and household chores carried out by children, data from 35 household surveys were analyzed for this article. Grouped by Millennium Development Region, these surveys are:
  • Developed countries: Albania.
  • Eastern Asia: Mongolia.
  • South-eastern Asia: Lao PDR, Philippines.
  • Southern Asia: India.
  • Western Asia: Bahrain, Lebanon, Palestinians in Syria.
  • Sub-Saharan Africa: Angola, Burundi, Central African Republic, Chad, Comoros, Congo, Côte d'Ivoire, Democratic Republic of the Congo, Gambia, Guinea, Guinea-Bissau, Kenya, Lesotho, Malawi, Mali, Niger, Senegal, Sierra Leone, Somalia, Swaziland, Tanzania, Uganda.
  • Latin America and the Caribbean: Bolivia, Colombia, Dominican Republic, Nicaragua, Trinidad and Tobago.
The surveys were conducted between 1999 and 2005. 26 of the surveys were Multiple Indicator Cluster Surveys (MICS) and 9 were Demographic and Health Surveys (DHS). All 35 surveys collected data on work by children in the week preceding the survey. Surveys conducted during school vacation were excluded because the focus of the present analysis is work by children that should have been in school at the time of the survey.

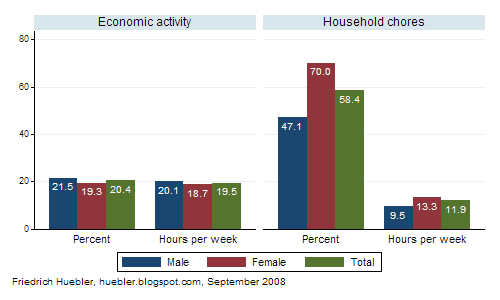
The share of children aged 7 to 14 years in economic activity and household chores is depicted in the following graph. The graph also displays the number of hours spent per week on both types of work. All numbers are averages across the 35 surveys, weighted by each country's population between 7 and 14 years.

Economic activity and household chores, children 7-14 years
Graph showing the link between household wealth and average years of education
Data source: 35 DHS and MICS surveys, 1999-2005.

The results confirm that boys are more likely to be engaged in economic activity while girls are more likely to do household chores. On average across the 35 surveys, 22 percent of all boys and 19 percent of all girls between 7 and 14 years are engaged in economic activity. Boys also spend more hours on economic activity than girls, 20 compared to 19 hours. By comparison, girls are much more likely than boys to do household chores. 70 percent of all girls and 47 percent of all boys did household chores in the week preceding the survey. On average, girls spent 13 hours and boys 10 hours per week on household chores.

What are the implications of these findings for statistics of child labor, as currently defined by the ILO? Take the case of two families that need additional income to provide food for everyone in the household. In the first family, a 10-year-old boy is withdrawn from school and put to work on a farm. Because such work is considered economic activity the number of child laborers goes up. In the second family, the mother decides to start working on a farm and her 10-year-old daughter is asked to stay at home to care for her younger siblings. Because the girl is engaged in household chores the number of child laborers does not change. The consequences are the same for both children: they no longer go to school and miss out on the benefits from education.

To address the limitations of the ILO's definition of child labor, UNICEF has developed an expanded definition that covers household chores in addition to economic activity. This revised indicator is the basis for the child labor estimates that are reported in publications like Progress for Children (UNICEF 2007a) or The State of the World’s Children (UNICEF 2007b). For children 5 to 17 years of age, UNICEF defines child labor as follows:
  • 5 to 11 years: any economic activity, or 28 hours or more household chores per week;
  • 12 to 14 years: any economic activity (except light work for less than 14 hours per week), or 28 hours or more household chores per week;
  • 15 to 17 years: any hazardous work, including any work for 43 hours or more per week.
The goal of UNICEF's child labor indicator is the measurement of work that should be eliminated because it violates international child labor conventions and interferes with school attendance. The threshold for household chores is set relatively high because it is assumed that household chores are less harmful than economic activity. Moreover, the high threshold of 28 hours household chores per week avoids a possible overestimation of the number of child laborers.

References
  • International Labour Organization (ILO). 2006. Global child labour trends 2000-2004. Geneva: ILO. (Download PDF, 640 KB)
  • United Nations Children's Fund (UNICEF). 2007a. Progress for children: A World Fit for Children statistical review. New York: UNICEF. (Download PDF, 3.6 MB)
  • United Nations Children's Fund (UNICEF). 2007b. The state of the world's children 2008: Child survival. New York: UNICEF. (Download PDF, 4.3 MB)
  • United Nations Statistics Division (UNSD). 2001. System of national accounts 1993. http://unstats.un.org/unsd/sna1993/toctop.asp.
Related articles
External links
Friedrich Huebler, 7 September 2008 (edited 5 October 2008), Creative Commons License
Permanent URL: http://huebler.blogspot.com/2008/09/child-labor.html

24 August 2008

Household wealth and years of education

At the national level, a country's wealth (measured by GDP per capita) and the education of its population (measured by school life expectancy) are highly correlated, as demonstrated in an article on national wealth and years of education. In developed countries with a high level of national income the population usually has more years of education than the population of low income countries.

A similar link can be observed at the level of individual households. Households whose members have a higher level of education are usually wealthier than households with less educated members. The relationship between household wealth and education can be analyzed with data from household surveys. This article looks at data from 12 nationally representative household surveys that were conducted between 2004 and 2006 in Bangladesh, Cambodia, Colombia, Egypt, Ethiopia, Haiti, India, Moldova, Nepal, Niger, Sierra Leone, and Zimbabwe. The data from Bangladesh and Sierra Leone is from Multiple Indicator Cluster Surveys (MICS) and the data from the other countries was collected with Demographic and Health Surveys (DHS).

DHS and MICS surveys collect data on assets owned by a household - for example, water supply and sanitation facilities, housing material, radio, telephone, refrigerator, bicycle, automobile, and livestock - that can be used to construct an index of household wealth (Filmer and Pritchett 2001). With this index it is possible to rank the households in a survey from poorest to richest. The households can then be divided into wealth deciles, each containing 10 percent of the sample population.

DHS and MICS surveys also collect data on the education of all household members above a certain age, usually 5 to 7 years. For the analysis in this article, the years of formal education of all household members aged 20 to 65 years were examined. For example, a person that did not complete primary school may have 3 years of education while someone with a university degree may have 16 years of education. In the next step, the average number of years of education within each wealth decile is calculated.

The data on household wealth and years of education is plotted in the graph below. Wealth deciles are plotted along the horizontal axis. The average number of years of education of persons aged 20 to 65 years in each wealth decile is plotted along the vertical axis. As an example, in Bangladesh, persons in the poorest decile have 1.3 years of education on average and persons in the richest decile have 10.1 years of education.

Household wealth and years of education
Graph showing the link between household wealth and average years of education
Data source: Demographic and Health Surveys (DHS), Multiple Indicator Cluster Surveys (MICS), 2004-2006.

The graph shows that an increase in the average years of education of all adult household members is correlated with an increase in household wealth. This relationship is true without exception in all 12 countries that were analyzed. Persons in higher wealth deciles always have more years of education than persons in lower deciles.

The graph also shows that the disparity between poorer and richer households in terms of education varies from country to country. In Moldova, almost everyone attends primary and secondary school and even in the poorest decile the average number of years of education is 9.3, compared to 13.6 years of education in the richest decile. In Zimbabwe, most persons attended at least primary school; persons in the poorest decile have 5.4 years of education on average and persons in the richest decile 11.4 years.

In contrast, Niger is a country where few persons between 20 and 65 years of age attended school. 80 percent of the population have less than 1 year of education. The average number of years of education is 0.3 in the poorest decile, 0.9 in the eighth decile, 1.8 in the ninth decile, and 5.3 in the richest decile. In Ethiopia, 80 percent of the adult population have fewer than 2 years of education and in Sierra Leone, 70 percent have fewer than 2 years of education. Cambodia and Nepal are also countries where a large part of the population has relatively little formal education.

In other countries, the increase in the number of years of education from poorer to richer deciles is more pronounced. In Egypt, persons in the poorest decile have 3.1 years of education on average and those in the richest decile have 13.8 years of education. In India, the average number of years of education is 1.4 in the poorest decile and 11.9 in the richest decile. In Haiti, the respective numbers are 1.2 and 10.7 years of education. In Colombia, the average number of years of education ranges from 3.6 in the poorest decile to 12.5 in the richest decile.

The positive link between wealth and years of education at the household level can be explained similarly to the link between these two variables at the national level. Persons with a higher level of education can earn more than those with less education. At the same time, members of wealthier households can afford education more easily than members of poorer households. At the extreme end, very poor families may not only lack the financial resources to send their children to school, they may also have to rely on the income from child labor to guarantee the survival of everyone in the household. This relationship between household wealth and child labor was analyzed in two articles on child labor and school attendance in Bolivia.

Reference
  • Filmer, Deon, and Lant H. Pritchett. 2001. Estimating wealth effects without expenditure data - or Tears: An application to educational enrollments in states of India. Demography 38 (1), February: 115-132.
Related articles
External links
Friedrich Huebler, 24 August 2008, Creative Commons License
Permanent URL: http://huebler.blogspot.com/2008/08/hh-wealth.html

10 May 2008

Adult literacy in sub-Saharan Africa

Literacy data published by the UNESCO Institute for Statistics (UIS) in 2007 shows that the lowest adult literacy rates are observed in Africa and South Asia. In some countries, fewer than three out of ten adults can read and write. UIS provides national literacy data for two age groups: youths aged 15 to 24 years, and adults aged 15 years and older. A more detailed analysis of literacy is possible with data from household surveys.

Most Demographic and Health Surveys (DHS) collect data on literacy for persons between 15 and 49 years. For male household members, literacy data is sometimes collected up to an age of 54, 59, or 64 years. To assess the degree of literacy, respondents to the survey are asked to read a card with a simple sentence. If a respondent can read the whole sentence, he or she is counted as literate, in accordance with UNESCO's definition of literacy as "the ability to read and write, with understanding, a short simple sentence about one’s everyday life". Recent Multiple Indicator Cluster Surveys (MICS) by UNICEF collect data on literacy with the same method, but only for female household members between 15 and 49 years. MICS surveys are therefore not covered by the analysis that follows.

This article examines data from eight DHS surveys that were carried out in sub-Saharan Africa between 2003 and 2006. The survey data is from Benin (2006), Burkina Faso (2003), Cameroon (2004), Lesotho (2004-05), Niger (2006), Nigeria (2003), Uganda (2006), and Zimbabwe (2005-06). The data can be used to calculate overall literacy rates and also to examine trends over time by comparing literacy rates in different age groups.

The following table lists literacy rates for the male, female, and total population between 15 and 49 years of age. Zimbabwe (85%) and Lesotho (79%) are the countries with the highest literacy rates, followed by Cameroon (63%), Uganda (58%), and Nigeria (55%). In Benin (33%), Burkina Faso (18%), and Niger (13%), adult literacy rates are much lower. In seven of the eight countries there is a large difference between male and female literacy rates. In Benin, Burkina Faso, Cameroon, Niger, Nigeria, and Uganda, more men than women are literate, with a gender gap ranging from 12% to 26%. In Lesotho, the literacy rate of women is 21% greater than the literacy rate of men. In Zimbabwe, the difference between the male and female literacy rate is only 6%.

Adult literacy rate (%), population 15-49 years
Country
Male Female Total
Benin 45.1 21.8 32.6
Burkina Faso 24.3 11.9 17.6
Cameroon 70.6 54.8 62.5
Lesotho 68.8 90.1 79.4
Niger 20.9 7.5 13.2
Nigeria 68.4 42.8 54.9
Uganda 68.6 48.9 58.4
Zimbabwe 87.9 81.5 84.5
Source: Demographic and Health Surveys 2003-2006

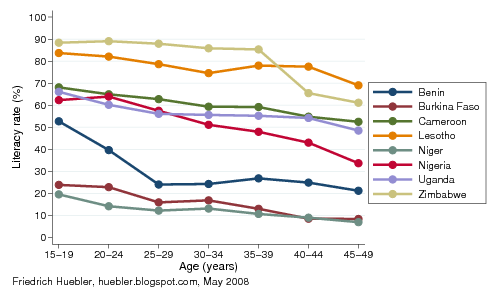
For the graph below, the survey respondents were divided into five-year age groups. In all countries, literacy rates among the younger population are higher than among the older population. The literacy rate of the youngest group, 15 to 19 years, can be interpreted as a measure of the coverage and quality of the primary school system during the 1990s, when the members of this age group were of primary school age.

In Burkina Faso, Cameroon, Lesotho, Niger, and Uganda, the difference between the literacy rates of 15- to 19-year-olds and 45- to 49-year-olds ranges from 13% to 18%. These numbers indicate a relatively modest expansion of the education system between the 1960s, when the older age group was of primary school age, and the 1990s. In contrast, in Benin, Nigeria, and Zimbabwe, the difference between the literacy rates of 15- to 19-year-olds and 45- to 49-year-olds ranges from 27% to 32%. These three countries were thus more successful in their efforts to increase the number of literate citizens than the other five countries.

In Burkina Faso and Niger, less than one quarter of the population between 15 and 19 years can read and write. However, the case of Benin shows that a large increase in literacy can be achieved within only ten years. In Benin, only 24% of 25- to 29-year-olds are literate but among 15- to 19-years-olds the literacy rate has grown to 53%.

Adult literacy by five-year age group
Graph with adult literacy rates by age in sub-Saharan Africa
Source: Demographic and Health Surveys 2003-2006

Related articles

External links

Friedrich Huebler, 10 May 2008, Creative Commons License
Permanent URL: http://huebler.blogspot.com/2008/05/literacy.html