The Global Education Digest 2005 from UNESCO has statistics on participation in pre-primary education for the school year 2002/03. The net enrollment ratio (NER) is listed for 149 countries, the gross enrollment ratio (GER) for 180 countries. The NER is the share of children of preschool age who are enrolled in preschool. The GER is the number of children in preschool, regardless of age, divided by the population of preschool age.
- NER = number of children of preschool age in preschool / number of children of preschool age
- GER = number of children in preschool / number of children of preschool age
For most countries the pre-primary NER and GER lie in the same range although there are notable exceptions, among them Australia, South Korea, and the Ukraine. For this reason, and because the GER is available for more countries, I focus on the GER to describe participation at the pre-primary level of education.
Pre-primary net enrollment ratio, 2002/2003
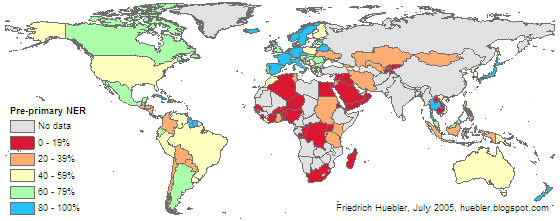
Data source: UNESCO Institute for Statistics (UIS). 2005. Global Education Digest 2005. Montreal: UIS.
Pre-primary gross enrollment ratio, 2002/2003

Data source: UNESCO Institute for Statistics (UIS). 2005. Global Education Digest 2005. Montreal: UIS.
The lower graph presents the pre-primary GER in the school year 2002/03. The GER is above 80% in most industrialized countries, but also in some countries of East Asia (for example Malaysia and Thailand), Latin America (for example Cuba and Mexico), and Eastern Europe (Belarus and Russia). The pre-primary GER is lowest in Africa and the Middle East, with most countries in the range below 20%. Low GER values are also observed in Central, South, and East Asia. In Sub-Saharan Africa this pattern of low participation continues at the primary level, while in East Asia primary school enrollment rates are significantly higher.
Friedrich Huebler, 25 July 2005, Creative Commons License.