This relationship can be demonstrated by plotting school net enrollment ratios (NER) against gross domestic product (GDP) per capita as a measure of national wealth. The graphs below present the primary and secondary school NER in 2002/03 (the latest year with data) in relation to GDP per capita in 2002. School enrollment figures are from the Global Education Digest 2005 by UNESCO and the GDP per capita from the World Development Indicators 2005 by the World Bank. The GDP data was adjusted with purchasing power parities (PPP) to take the price levels in different countries into account. In addition, the GDP per capita is plotted on a logarithmic scale so that the relationship with NER can be seen more easily.
The first graph makes clear that low income countries have significantly lower levels of primary school enrollment. Most countries with a GDP per capita of $2,500 or less have net enrollment ratios below 80%. Almost all countries above this level of GDP have NER values of more than 80%.
Primary school net enrollment ratio and GDP per capita, 2002
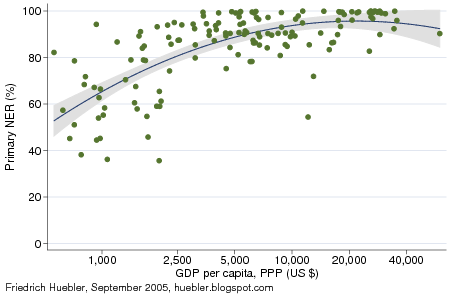
Data sources: (1) Primary school NER: Global Education Digest 2005, UNESCO Institute for Statistics. - (2) GDP per capita: World Development Indicators 2005, World Bank.
The link between national wealth and school enrollment is even more obvious at the secondary level of education. Virtually all countries with a secondary school NER below 60% have a GDP per capita of less than $10,000. In contrast, all countries with a per capita income of more than $15,000 have NER levels near or above 80%.
Secondary school net enrollment ratio and GDP per capita, 2002
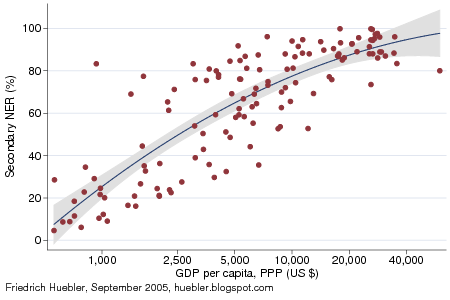
Data sources: (1) Secondary school NER: Global Education Digest 2005, UNESCO Institute for Statistics. - (2) GDP per capita: World Development Indicators 2005, World Bank.
Related articles
- National wealth and years of education
- Household wealth and years of education
- Poverty and educational attainment in the United States
- Poverty and educational attainment in the United States, part 2
Permanent URL: http://huebler.blogspot.com/2005/09/national-wealth-and-school-enrollment.html


No comments:
Post a Comment