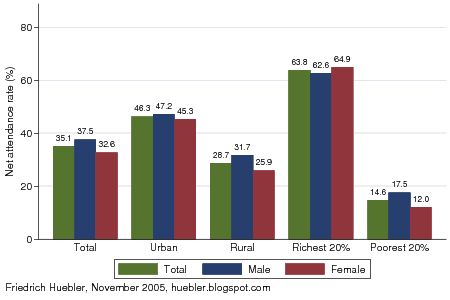
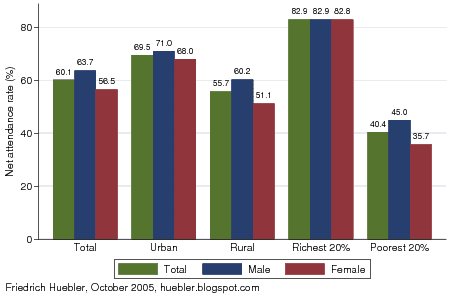
The primary school age in Nigeria is 6 to 11 years and the secondary school age 12 to 17 years. As I showed in previous posts, the primary school net attendance rate (NAR) in Nigeria is 60.1% and the secondary school NAR 35.1%. This means that 60.1% (35.1%) of all children of primary (secondary) school age were attending primary (secondary) school at the time of the survey. Attendance rates are higher for boys compared to girls and for urban residents compared to rural residents. Household wealth is also strongly linked to school attendance, as the graph below demonstrates.
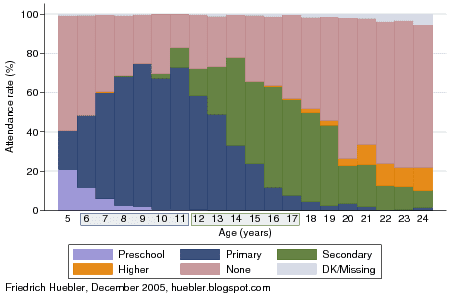
School attendance by age and household wealth, Nigeria 2003
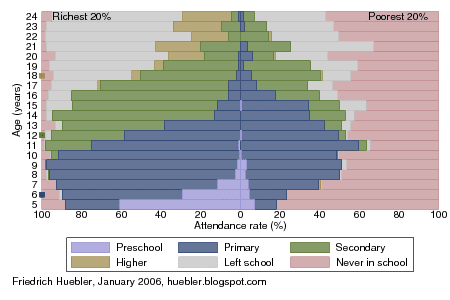
Data source: Nigeria 2003 DHS.
The graph is constructed as two back-to-back bar graphs, similar to a population pyramid, but the two halves don't indicate age and sex but age and household wealth. The left half has the school attendance rates of the richest 20% of all households in Nigeria, as identified with the wealth index, and the right half the attendance rates of the poorest 20%. Only the population aged 5 to 24 years of age is covered because the DHS did not collected data on current school attendance for other ages. The population is divided into six groups:
- currently attending preschool (purble bars)
- currently attending primary school (blue bars)
- currently attending secondary school (green bars)
- currently attending higher education (brown bars)
- attended school in the past but no longer in school (gray bars)
- never attended school (red bars)
In addition, those from wealthy households are much more likely to attend primary and secondary school at the proper age. The blue, green and brown markers along the left axis indicate the official starting ages of primary, secondary and tertiary education: 6, 12 and 18 years, respectively. Children from the poorest 20% of the population typically enter primary school much later than those from the richest 20% - if they attend school at all - and they typically do so without the advantage of having been in preschool first. Those from the richest households are also more likely to continue their education at the secondary or tertiary level.
In conclusion, to reach the Millennium Development Goal of universal primary education, Nigeria clearly has to target the poorest part of its population.
References: Filmer, Deon, and Lant H. Pritchett. 2001. Estimating wealth effects without expenditure data - or Tears: An application to educational enrollments in states of India. Demography 38 (1), February: 115-132.
Related articles:
- Primary school attendance in Nigeria
- Secondary school attendance in Nigeria
- Age and level of education in Nigeria
- Education data from household surveys
Friedrich Huebler, 21 January 2006, Creative Commons License