In Nepal, disparities are also closely linked to the Hindu caste system that divides the population into dozens of hereditary groups. At the top of the social order are members of the Brahman class of priests and scholars, followed by the Kshatriya (rulers and warriors), the Vaishya (merchants), and the Sudra (peasants and manual laborers). The lowest position in the social order is occupied by the Dalits, also referred to as "untouchables." For example, Dalits may not enter temples or fetch water from wells that are also used by members of higher castes. Although caste-based discrimination was outlawed in Nepal in 1963 it is still present in Nepali society.
Social exclusion based on caste is interlinked with exclusion based on ethnicity and religion. Members of the indigenous population of Nepal, called Janajatis, were historically ranked between the highest and lowest castes. Muslims were discriminated by virtue of belonging to a religious minority in a Hindu state and ranked above Dalits but below other groups.
The 2001 census in Nepal identified 103 social groups based on caste, ethnicity, religion, and language. Caste groups accounted for 57.5 percent of the population, Janajatis for 37.2 percent, religious minorities for 4.3 percent, and other groups for the remaining 1 percent. This large number of social groups makes it difficult to analyze patterns of exclusion. To simplify such an analysis, a recent multi-year Gender and Social Exclusion Assesssment (GSEA) by the British Department for International Development (DFID) and the World Bank, in collaboration with the National Planning Commission of Nepal, combined the 103 social groups in 10 major categories. The results of the GSEA were published in 2006 in the report Unequal citizens: Gender, caste and ethnic exclusion in Nepal. Table 1 provides an overview of the simplified caste and ethnic groups from the GSEA.
Table 1: Caste and ethnic groups in Nepal
| Share of population | Simplified group | 2001 census group |
| Hindu caste groups (57.5%) | 1. Brahmans and Chhetris (Hill) | Brahman, Chhetri, Thakuri, Sanyasi |
| 2. Brahmans and Chhetris (Tarai) | Kayashta, Rajput, Baniya, Marwadi, Jaine, Nurang, Bengali | |
| 3. Tarai Middle Castes | Yadev,Teli, Kalwar, Sudi, Sonar, Lohar, Koiri, Kurmi, Kanu, Haluwai, Hajam/Thakur, Badhe, Rajbhar, Kewat Mallah, Numhar, Kahar, Lodha, Bing/Banda, Bhediyar, Mali, Kamar Dhunia | |
| 4. Dalits (Hill) | Kami, Damai, Sarki, Gaine, Badi | |
| 5. Dalits (Tarai) | Chamar, Musahar, Tatma, Bantar, Dhusadadh/Paswan, Khatway, Dom, Chidimar, Dhobi, Halkhor, Unidentified Dalit | |
| Janajatis (37.2%) | 6. Newar | All Newari Castes |
| 7. Janajatis (Hill) | Magar,Tamang, Rai, Gurung, Limbu, Sherpa, Bhote, Walung, Buansi, Hyolmo, Gharti/Bhujel, Kumal, Sunuwar, Baramu, Pahari, Adivasi Janajati, Yakkha, Shantal, Jirel, Darai, Dura, Majhi, Dunuwar, Thami, Lepcha, Chepang, Bote, Raji, Hayu,Raute, Kasunda | |
| 8. Janajatis (Tarai) | Tharu, Dhanuk, Rajbanshi, Tajpuriya, Gangai, Dhimal, Meche, Kisan, Munda, Santhal/Satar/Dhangad/Jhangad, Koche, Pattarkatta/Kusbadiya | |
| Muslims (4.3%) | 9. Muslims | Muslim, Churoute |
| Others (1%) | 10. Others |
Three groups - Brahmans and Chhetris, Dalits, and Janajatis - are further divided by geographic region. About 49 percent of the population of Nepal live in the southern tarai or terai region, the most fertile area of Nepal. 44 percent of the population live in the central hill zone that includes the capital Kathmandu. The mountain region of northern Nepal is home to only 7 percent of the population.
The composition of the population of Nepal by simplified caste and ethnic group, according to the 2001 census, is shown in Figure 1. Hill Brahman and Chhetri account for 30.9 percent of the population. The second largest group are Hill Janajatis, with 23.0 percent of the population. 12.9 percent of the population are in Tarai Middle Castes. Each of the remaining seven caste and ethnic groups account for less than 10 percent of the population.
Figure 1: Distribution of caste and ethnic groups in Nepal
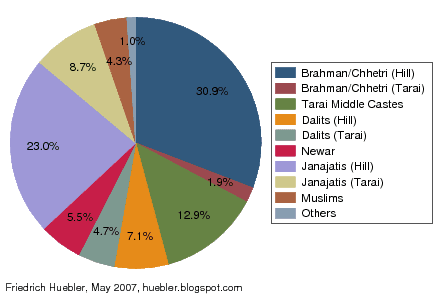
Source: World Bank, and Department For International Development (DFID). 2006. Unequal citizens: Gender, caste and ethnic exclusion in Nepal - Summary. Kathmandu: World Bank, Department For International Development. Figure 6, page 18.
The simplified caste and ethnic groups created by the Nepal Gender and Social Exclusion Assessment can be used to reveal disparities in the education system that go beyond characteristics like gender and household wealth (see the article Primary and secondary school attendance in Nepal on this site).
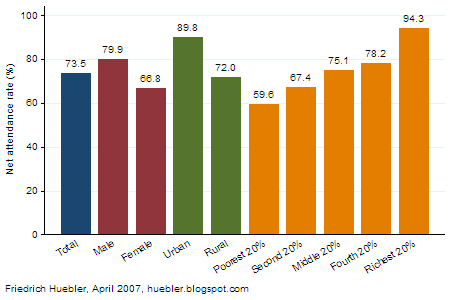
Figure 2 shows the primary school net attendance rate (NAR) - the share of children of primary school age who attend primary school - by caste or ethnicity of the household head. The data on school attendance is from a 2001 Demographic and Health Survey, a nationally representative household survey.
At the level of the country as a whole, the primary school NAR is 73.5 percent. Children from Brahman, Chhetri, and Newar households have the highest NAR values, between 86.8 and 93 percent. The lowest primary school net attendance rates are observed among Muslims (32.1 percent) and Tarai Dalits (37.5 percent). Hill Dalits (primary NAR 73.5 percent) are much more likely to attend school than Tarai Dalits. This difference in school participation can be explained by the fact that Dalits from the hill zone of Nepal are more integrated into society and therefore less subject to discrimination than Dalits from the southern tarai.
Figure 2: Primary school attendance in Nepal by caste or ethnic group of household head
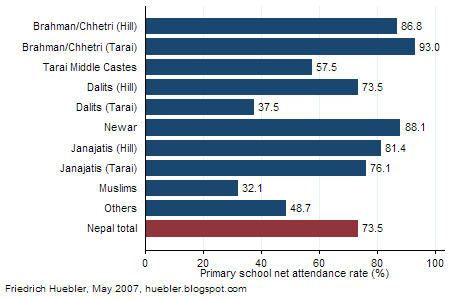
Source: Nepal 2001 Demographic and Health Survey (DHS).
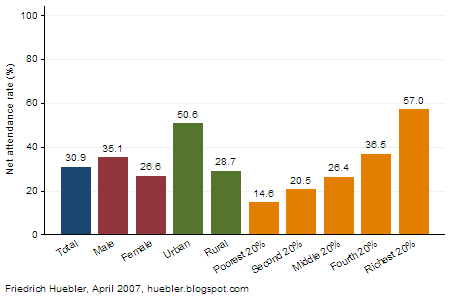
Secondary school net attendance rates in Nepal are shown in Figure 3. Overall, 30.9 percent of all Nepali children of secondary school age attend secondary school. The pattern of disparity is similar to that at the primary level of the education system. NAR values are highest among children from Newar, Brahman, and Chhetri households, ranging from 44.6 to 52.3 percent. Tarai Dalits (secondary NAR 7.2 percent) and Muslims (7.9 percent) are least likely to attend secondary school. Similar to the primary level, Hill Dalits have a net attendance rate that is twice as high as that of Tarai Dalits.
Figure 3: Secondary school attendance in Nepal by caste or ethnic group of household head
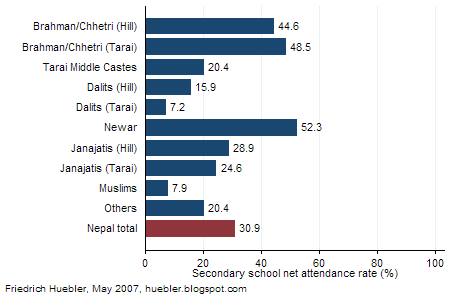
Source: Nepal 2001 Demographic and Health Survey (DHS).
In a diverse society like Nepal, an analysis of school attendance by caste and ethnicity helps policy makers identify groups that are lagging behind other parts of the population. To build an equitable and inclusive society, and to reach the Millennium Development Goal of universal primary education, it is necessary to design policies that aid Muslims, Tarai Dalits, and other disadvantaged groups in Nepal.
References
- Geiser, Alexandra. 2005. Social exclusion and conflict transformation in Nepal: Women, dalit and ethnic groups. Bern: Swiss Peace Foundation. (Download PDF, 745 KB)
- World Bank, and Department For International Development (DFID). 2006. Unequal citizens: Gender, caste and ethnic exclusion in Nepal - Summary. Kathmandu: World Bank, Department For International Development. (Download PDF, 14.5 MB)
- Primary and secondary school attendance in Nepal
- Nepal: trends in primary education, 1980-2004
- Education disparity in South Asia
- Education disparity trends in South Asia
- Disparities in primary school attendance by ethnicity, language or religion
- Education data from household surveys
- United Nations Millennium Development Goals
- Demographic and Health Surveys (DHS)
- UK Department for International Development (DFID)
- World Bank
Permanent URL: http://huebler.blogspot.com/2007/05/caste-ethnicity-and-school-attendance.html