The UNESCO Institute for Statistics (UIS) has announced the final release of data from its 2005 education survey. The data, an update of the initial release from April 2006, can be downloaded from the UIS education database. I used the data to update two recent posts on primary school enrollment in 2004 and on trends in primary school enrollment from 1970 to 2004.
Friedrich Huebler, 27 October 2006, Creative Commons License
27 October 2006

28 September 2006
Trends in primary school enrollment, 1970-2004
The latest data released by the UNESCO Institute for Statistics (UIS) shows that the world has come closer than ever to the goal of universal primary education. In 2004, the global primary school net enrollment rate (NER) was at 86%. This means that worldwide almost 9 out of 10 children of primary school age are enrolled in primary school. A comparison of national enrollment rates shows that many countries in Sub-Saharan Africa continue to lag behind countries in other regions.
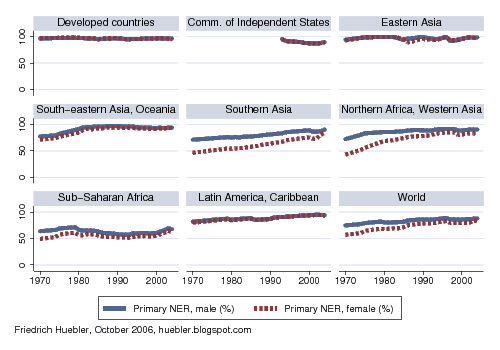
With enrollment data from UNESCO for the years since 1970 it is possible to assess how much progress has been made over the past decades. The graph below compares the primary NER trends for boys and girls by Millennium Development Goal (MDG) region. For the graph, the MDG regions South-eastern Asia and Oceania were combined in one region, as were Northern Africa and Western Asia.
Primary school net enrollment rate (NER), 1970-2004
Data sources: (1) UNESCO Institute for Statistics, global education database, October 2006; (2) UNESCO Institute for Statistics, pre-1998 database, March 2005.
At the global level, shown in the lower right corner of the graph, there has been a steady increase in the primary NER of boys and girls since 1970. In addition, the gap between boys and girls has shrunk significantly. The male primary NER for 2004 is 88% and the female NER is 84%.
A comparison of regional trends shows clear differences in participation in primary education. In the developed countries, the primary school NER has been close to 100% for more than three decades. In Eastern Asia, enrollment rates were similarly high since 1970, with small up- and downturns. For the countries in the Commonwealth of Independent States, only post-Soviet data is available, showing a decline of the NER to about 90% in 2004. In South-eastern Asia and Oceania, the primary NER has been above 90% since the early 1980s. In Latin America and the Caribbean, gender parity in primary education has existed since 1970, and enrollment rates have increased steadily to an average primary NER of 94% in 2004.
Southern Asia, and Northern Africa and Western Asia stand out as regions where the education of girls has seen dramatic improvements. However, the primary NER of girls continues to be below that of boys, with a gender gap of about 6% in these regions. The enrollment rates of boys have also steadily increased over the past three decades. In 2004, the average primary NER for boys and girls combined was 87% in Southern Asia and 90% in Northern Africa and Western Asia.
Sub-Saharan Africa also witnessed a decrease in the gender gap since 1970 but overall enrollment rates stagnated below 60% throughout the 1980s and 1990s. Since 2000, there has been an improvement in primary school enrollment rates, due to renewed efforts to bring all children into school. By 2004, the primary NER of boys has risen to 70% and the NER of girls is at 65%.
Related articles
Friedrich Huebler, 28 September 2006 (edited 27 October 2006), Creative Commons License
With enrollment data from UNESCO for the years since 1970 it is possible to assess how much progress has been made over the past decades. The graph below compares the primary NER trends for boys and girls by Millennium Development Goal (MDG) region. For the graph, the MDG regions South-eastern Asia and Oceania were combined in one region, as were Northern Africa and Western Asia.
Primary school net enrollment rate (NER), 1970-2004
Data sources: (1) UNESCO Institute for Statistics, global education database, October 2006; (2) UNESCO Institute for Statistics, pre-1998 database, March 2005.
At the global level, shown in the lower right corner of the graph, there has been a steady increase in the primary NER of boys and girls since 1970. In addition, the gap between boys and girls has shrunk significantly. The male primary NER for 2004 is 88% and the female NER is 84%.
A comparison of regional trends shows clear differences in participation in primary education. In the developed countries, the primary school NER has been close to 100% for more than three decades. In Eastern Asia, enrollment rates were similarly high since 1970, with small up- and downturns. For the countries in the Commonwealth of Independent States, only post-Soviet data is available, showing a decline of the NER to about 90% in 2004. In South-eastern Asia and Oceania, the primary NER has been above 90% since the early 1980s. In Latin America and the Caribbean, gender parity in primary education has existed since 1970, and enrollment rates have increased steadily to an average primary NER of 94% in 2004.
Southern Asia, and Northern Africa and Western Asia stand out as regions where the education of girls has seen dramatic improvements. However, the primary NER of girls continues to be below that of boys, with a gender gap of about 6% in these regions. The enrollment rates of boys have also steadily increased over the past three decades. In 2004, the average primary NER for boys and girls combined was 87% in Southern Asia and 90% in Northern Africa and Western Asia.
Sub-Saharan Africa also witnessed a decrease in the gender gap since 1970 but overall enrollment rates stagnated below 60% throughout the 1980s and 1990s. Since 2000, there has been an improvement in primary school enrollment rates, due to renewed efforts to bring all children into school. By 2004, the primary NER of boys has risen to 70% and the NER of girls is at 65%.
Related articles
Friedrich Huebler, 28 September 2006 (edited 27 October 2006), Creative Commons License
07 September 2006
Primary school enrollment in 2004
At the United Nations Millennium Summit in 2000, all UN member states agreed on a set of eight Millennium Development Goals (MDG) that should be reached by 2015. One of the goals aims at universal primary education by 2015, another goal at the elimination of gender disparity at all levels of education by 2015.
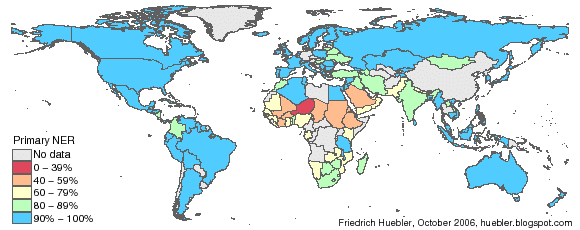
The UNESCO Institute for Statistics (UIS) maintains an annually updated database with education statistics. With the help of this database, it is possible to track the progress toward the MDGs related to education. The latest statistics on primary school enrollment rates were released in September. The map below shows the primary school net enrollment rate (NER) in each country. The primary NER is defined as the share of children of primary school age who are enrolled in primary school.
For all countries with data, the primary NER is indicated in the map below. Outside of Africa, most countries have NER values above 80 percent. In 7 countries, all in Africa or the Middle East, less than half of all primary-age children are enrolled in primary school: Djibouti (primary NER 32%), Niger (39%), Burkina Fast (41%), Sudan (43%), Guinea-Bissau (45%), Eritrea (46%), and Mali (47%).
Primary school net enrollment rate (NER), 2004
Data source: UNESCO Institute for Statistics, global education database, October 2006.
The table below lists the average primary school NER at the level of the 10 Millennium Development Goal regions. To calculate the regional averages, the primary NER in each country was weighted by the country's population of primary school age. To calculate the average enrollment rate in Sub-Saharan Africa, for example, the primary NER in Nigeria (60%, 21.6 million children of primary school age in 2005) therefore has a greater weight than the primary NER in Sao Tome and Principe (98%, 23,000 children of primary school age in 2005).
Primary school net enrollment rate, 2004
GPI: gender parity index. - Data source: UNESCO Institute for Statistics, Global Education Database, October 2006.
In 6 of the 10 regions, the primary school NER is at or above 90%: developed countries (96%), Commonwealth of Independent States (90%), Eastern Asia (99%), South-eastern Asia (94%), Northern Africa (94%), and Latin America and the Caribbean (94%). In Oceania, the NER is 86%, in Southern Asia it is 87%, and in Western Asia 83%. In Sub-Saharan Africa, far fewer children go to school; in this region, the primary NER is 67%. At the global level, the primary school net enrollment rate is 86%.
In addition to the total NER, the table also lists the enrollment rates of boys and girls. In the last two columns, the difference between the male and female NER, and the gender parity index (GPI) are shown. The GPI is the ratio of the female to the male NER. If the GPI is below 1, more boys than girls are enrolled in school. According to UNESCO, a GPI between 0.98 and 1.02 is interpreted as gender parity. Of the 10 regions, 6 have already reached the Millennium Development Goal of gender parity: developed countries, Commonwealth of Independent States, Eastern Asia, South-eastern Asia, Oceania, and Latin America and the Caribbean. In Southern Asia (GPI 0.93), Western Asia (0.90), Northern Africa (0.97), and Sub-Saharan Africa (0.92), the enrollment of girls is lagging behind that of boys.
To summarize, countries in Sub-Saharan Africa face the greatest challenges on the path to reaching the Millennium Development Goals of universal primary education and gender parity. Southern and Western Asia have higher enrollment rates but are not close to the goal of gender parity.
Related articles
Friedrich Huebler, 7 September 2006 (edited 26 October 2006), Creative Commons License
The UNESCO Institute for Statistics (UIS) maintains an annually updated database with education statistics. With the help of this database, it is possible to track the progress toward the MDGs related to education. The latest statistics on primary school enrollment rates were released in September. The map below shows the primary school net enrollment rate (NER) in each country. The primary NER is defined as the share of children of primary school age who are enrolled in primary school.
- Primary school net enrollment rate (NER) = Number of children of primary school age enrolled in primary school / Number of children of primary school age
For all countries with data, the primary NER is indicated in the map below. Outside of Africa, most countries have NER values above 80 percent. In 7 countries, all in Africa or the Middle East, less than half of all primary-age children are enrolled in primary school: Djibouti (primary NER 32%), Niger (39%), Burkina Fast (41%), Sudan (43%), Guinea-Bissau (45%), Eritrea (46%), and Mali (47%).
Primary school net enrollment rate (NER), 2004
Data source: UNESCO Institute for Statistics, global education database, October 2006.
The table below lists the average primary school NER at the level of the 10 Millennium Development Goal regions. To calculate the regional averages, the primary NER in each country was weighted by the country's population of primary school age. To calculate the average enrollment rate in Sub-Saharan Africa, for example, the primary NER in Nigeria (60%, 21.6 million children of primary school age in 2005) therefore has a greater weight than the primary NER in Sao Tome and Principe (98%, 23,000 children of primary school age in 2005).
Primary school net enrollment rate, 2004
| MDG region | NER (%) | Gender disparity | |||
| Total | Male | Female | Difference male- female | GPI female/ male | |
| Developed countries | 95.9 | 96.6 | 95.1 | 1.5 | 0.98 |
| Commonwealth of Independent States | 89.6 | 89.7 | 89.4 | 0.3 | 1.00 |
| Eastern Asia | 98.6 | 98.8 | 98.4 | 0.4 | 1.00 |
| South-eastern Asia | 93.6 | 94.5 | 93.1 | 1.4 | 0.99 |
| Oceania | 86.4 | 86.8 | 85.5 | 1.3 | 0.98 |
| Southern Asia | 87.1 | 90.1 | 83.9 | 6.2 | 0.93 |
| Western Asia | 83.1 | 87.2 | 78.8 | 8.4 | 0.90 |
| Northern Africa | 93.7 | 95.2 | 92.2 | 3.0 | 0.97 |
| Sub-Saharan Africa | 67.2 | 69.6 | 64.7 | 4.9 | 0.92 |
| Latin America and the Caribbean | 94.0 | 94.4 | 94.3 | 0.1 | 1.00 |
| World | 86.0 | 87.8 | 83.7 | 4.1 | 0.95 |
In 6 of the 10 regions, the primary school NER is at or above 90%: developed countries (96%), Commonwealth of Independent States (90%), Eastern Asia (99%), South-eastern Asia (94%), Northern Africa (94%), and Latin America and the Caribbean (94%). In Oceania, the NER is 86%, in Southern Asia it is 87%, and in Western Asia 83%. In Sub-Saharan Africa, far fewer children go to school; in this region, the primary NER is 67%. At the global level, the primary school net enrollment rate is 86%.
In addition to the total NER, the table also lists the enrollment rates of boys and girls. In the last two columns, the difference between the male and female NER, and the gender parity index (GPI) are shown. The GPI is the ratio of the female to the male NER. If the GPI is below 1, more boys than girls are enrolled in school. According to UNESCO, a GPI between 0.98 and 1.02 is interpreted as gender parity. Of the 10 regions, 6 have already reached the Millennium Development Goal of gender parity: developed countries, Commonwealth of Independent States, Eastern Asia, South-eastern Asia, Oceania, and Latin America and the Caribbean. In Southern Asia (GPI 0.93), Western Asia (0.90), Northern Africa (0.97), and Sub-Saharan Africa (0.92), the enrollment of girls is lagging behind that of boys.
To summarize, countries in Sub-Saharan Africa face the greatest challenges on the path to reaching the Millennium Development Goals of universal primary education and gender parity. Southern and Western Asia have higher enrollment rates but are not close to the goal of gender parity.
Related articles
Friedrich Huebler, 7 September 2006 (edited 26 October 2006), Creative Commons License
20 August 2006
Millennium Development Goal regions and UNICEF regions
This site presents education statistics from the perspective of the United Nations Millennium Development Goals (MDG). The second of the eight Millennium Development Goals calls for universal primary education by 2015. The third MDG calls for the elimination of gender disparity in primary and secondary education by 2005 and at all levels of education by 2015.
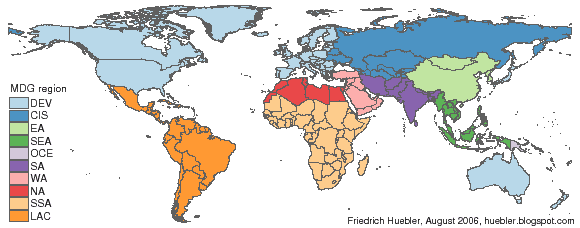
To monitor progress toward the eight MDG, the UN has divided all countries into ten regional groupings, shown in the map below. The list of countries within each region is available on the official UN site for the MDG indicators. The abbreviations in the map's legend stand for these regions:
Source: UN Statistics Division web site, August 2006
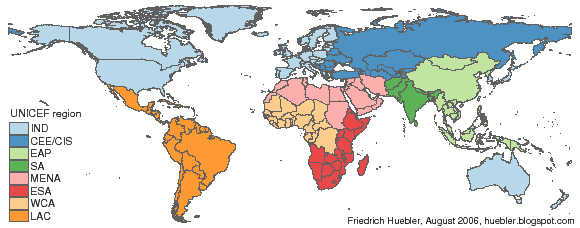
Future posts on global education statistics will refer to the MDG regions for regionally disaggregated data. In previous posts, for example on primary school enrollment, global education statistics were presented with the regional groupings used by UNICEF. UNICEF divides all countries into eight regions, shown in the following map. The countries within each region are listed on the UNICEF web site.
UNICEF regions
Source: UNICEF web site, August 2006
The abbreviations stand for these regions:
Related articles
Friedrich Huebler, 20 August 2006 (edited 26 March 2011), Creative Commons License.
Permanent URL: http://huebler.blogspot.com/2006/08/millennium-development-goal-regions.html
To monitor progress toward the eight MDG, the UN has divided all countries into ten regional groupings, shown in the map below. The list of countries within each region is available on the official UN site for the MDG indicators. The abbreviations in the map's legend stand for these regions:
- Developed countries (DEV)
- Commonwealth of Independent States (CIS)
- Eastern Asia (EA)
- South-eastern Asia (SEA)
- Oceania (OCE)
- Southern Asia (SA)
- Western Asia (WA)
- Northern Africa (NA)
- Sub-Saharan Africa (SSA)
- Latin America and the Caribbean (LAC)
Source: UN Statistics Division web site, August 2006
Future posts on global education statistics will refer to the MDG regions for regionally disaggregated data. In previous posts, for example on primary school enrollment, global education statistics were presented with the regional groupings used by UNICEF. UNICEF divides all countries into eight regions, shown in the following map. The countries within each region are listed on the UNICEF web site.
UNICEF regions
Source: UNICEF web site, August 2006
The abbreviations stand for these regions:
- Industrialized countries (IND)
- Central and Eastern Europe, Commonwealth of Independent States (CEE/CIS)
- East Asia and the Pacific (EAP)
- South Asia (SA)
- Middle East and North Africa (MENA)
- Eastern and Southern Africa (ESA)
- West and Central Africa (WCA)
- Latin America and the Caribbean (LAC)
Related articles
- Education for All regions
- UN Millennium Development Goals Report 2008
- UN Millennium Development Goals Report 2007
Friedrich Huebler, 20 August 2006 (edited 26 March 2011), Creative Commons License.
Permanent URL: http://huebler.blogspot.com/2006/08/millennium-development-goal-regions.html
31 July 2006
Child labor and school attendance in Bolivia, part 2
Child labor interferes with school attendance and is therefore an obstacle to the Millennium Development Goal of universal primary education. In Bolivia, 90 percent of all children between 5 and 14 years of age attend school. At the same time, one third of all children in this age group are engaged in child labor, as shown in a previous post on child labor and school attendance in Bolivia.
For the purpose of this analysis, child labor is defined as any economic activity during the week of the survey, or more than two hours of household chores per day. The data for Bolivia were collected in a Multiple Indicator Cluster Survey (MICS) in 2000. The previous post presented the data on child labor and schooling disaggregated by age group, sex, area of residence, and household wealth. Today's article will take a closer look at the pattern of work and school attendance by age.
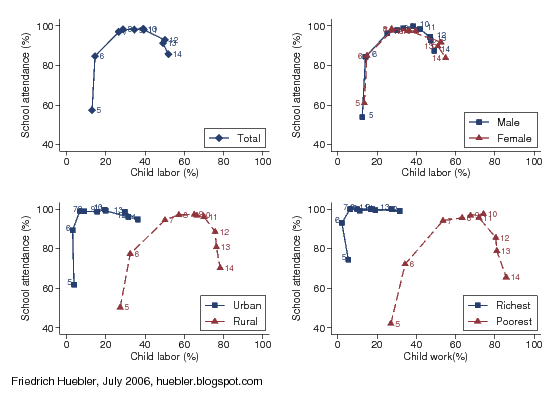
The graph belows present the share of children aged 5 to 14 years who attend school or are engaged in child labor. School attendance is defined as attending any level of education at the time of the MICS survey. Each point represents children of a single age, from 5 years, 6 years, and so on, to 14 years of age. Child labor rates are plotted against the horizontal axis, school attendance rates against the vertical axis.
Child labor and school attendance by age, children 5-14 years, Bolivia
Data source: Bolivia 2000 MICS.
The upper left quadrant shows the values for all children combined. The inverted U shape indicates that children work steadily more as they grow older, while school attendance rates reach a peak near 100 percent for children between 7 and 11 years of age and then decrease again. The upper right quadrant, with data disaggregated by gender, makes clear that there is no difference between boys and girls in Bolivia, as far as work and school are concerned.
There are, however, big differences between children from urban and rural areas, as the lower left quadrant shows. Among urban children, school attendance rates rise rapidly with age and at 7 years, 99 percent of all children are in school. Few children drop out as they grow older and among 14-year-olds, the school attendance rate is still 95 percent. In rural areas, school attendance rates for children between 7 and 11 years of age are also above 90 percent.
Compared to urban children, rural children are much more likely to be engaged in child labor. The highest child labor rate in urban areas is observed for children 14 years old (36 percent). In contrast, one third of all 6-year-olds (32 percent) and half of all 7-year-olds (50 percent) do child labor. Child labor rates continue to increase with age and at 14 years, 78 percent of all rural children work, compared to 70 percent in this age group who attend school.
The last graph, in the lower right quadrant, compares children from the richest and poorest 20 percent of all households. The overall pattern is very similar to that for urban and rural children. Children from wealthy households are much more likely to attend school and less likely to work than children from poor households. In the richest household quintile, school attendance rates are between 99 and 100 percent for all children aged 7 to 14 years, while child labor rates do not exceed 32 percent. In the poorest household quintile, the child labor rate reaches 86 percent among 14-year-old children. 66 percent of 14-year-olds from the poorest household are in school.
A comparison of the individual graphs makes clear that the overall pattern of child labor and school attendance in Nepal is strongly influenced by children from poor, rural households. Many of these children work and do not complete their education.
Related articles
Permanent URL: http://huebler.blogspot.com/2006/07/child-labor-and-school-attendance-in.html
For the purpose of this analysis, child labor is defined as any economic activity during the week of the survey, or more than two hours of household chores per day. The data for Bolivia were collected in a Multiple Indicator Cluster Survey (MICS) in 2000. The previous post presented the data on child labor and schooling disaggregated by age group, sex, area of residence, and household wealth. Today's article will take a closer look at the pattern of work and school attendance by age.
The graph belows present the share of children aged 5 to 14 years who attend school or are engaged in child labor. School attendance is defined as attending any level of education at the time of the MICS survey. Each point represents children of a single age, from 5 years, 6 years, and so on, to 14 years of age. Child labor rates are plotted against the horizontal axis, school attendance rates against the vertical axis.
Child labor and school attendance by age, children 5-14 years, Bolivia
Data source: Bolivia 2000 MICS.
The upper left quadrant shows the values for all children combined. The inverted U shape indicates that children work steadily more as they grow older, while school attendance rates reach a peak near 100 percent for children between 7 and 11 years of age and then decrease again. The upper right quadrant, with data disaggregated by gender, makes clear that there is no difference between boys and girls in Bolivia, as far as work and school are concerned.
There are, however, big differences between children from urban and rural areas, as the lower left quadrant shows. Among urban children, school attendance rates rise rapidly with age and at 7 years, 99 percent of all children are in school. Few children drop out as they grow older and among 14-year-olds, the school attendance rate is still 95 percent. In rural areas, school attendance rates for children between 7 and 11 years of age are also above 90 percent.
Compared to urban children, rural children are much more likely to be engaged in child labor. The highest child labor rate in urban areas is observed for children 14 years old (36 percent). In contrast, one third of all 6-year-olds (32 percent) and half of all 7-year-olds (50 percent) do child labor. Child labor rates continue to increase with age and at 14 years, 78 percent of all rural children work, compared to 70 percent in this age group who attend school.
The last graph, in the lower right quadrant, compares children from the richest and poorest 20 percent of all households. The overall pattern is very similar to that for urban and rural children. Children from wealthy households are much more likely to attend school and less likely to work than children from poor households. In the richest household quintile, school attendance rates are between 99 and 100 percent for all children aged 7 to 14 years, while child labor rates do not exceed 32 percent. In the poorest household quintile, the child labor rate reaches 86 percent among 14-year-old children. 66 percent of 14-year-olds from the poorest household are in school.
A comparison of the individual graphs makes clear that the overall pattern of child labor and school attendance in Nepal is strongly influenced by children from poor, rural households. Many of these children work and do not complete their education.
Related articles
- Child labor and school attendance in Bolivia
- Child labor and school attendance
- Child labor: economic activity and household chores
- Primary school attendance in Bolivia
- Secondary school attendance in Bolivia
- Education data from household surveys
- UNICEF priority countries for girls' education
- Household wealth and years of education
Permanent URL: http://huebler.blogspot.com/2006/07/child-labor-and-school-attendance-in.html
Subscribe to:
Posts (Atom)

