26 October 2008

Pupil/teacher ratio in primary school

Global primary school attendance rates have been on a steady upward trend over the past years. As the world moves closer to the goal of universal primary education, the issue of education quality attracts increasing attention. One measure of education quality is the pupil/teacher ratio, the number of pupils per teacher in a school. Teachers of a large class can dedicate less time to each pupil than in a small class. For the pupils, crowded classrooms make it difficult to concentrate on the material and to learn. The results of overcrowding are lower academic achievement and increased dropout rates.

The map below displays the pupil/teacher ratio in primary school in 194 countries and territories for which data were available. The data were obtained from the UNESCO Institute for Statistics. For 124 countries, the pupil/teacher ratios are from 2006, 12 countries have data from 2007, 42 countries have data from 2004 or 2005, and the remaining 16 countries have data from 1999 to 2003. For the map, all countries were divided into five groups:
  • Fewer than 10 pupils per teacher: 7 countries
  • 10 to 19 pupils per teacher: 90 countries
  • 20 to 29 pupils per teacher: 43 countries
  • 30 to 39 pupils per teacher: 27 countries
  • 40 or more pupils per teacher: 27 countries
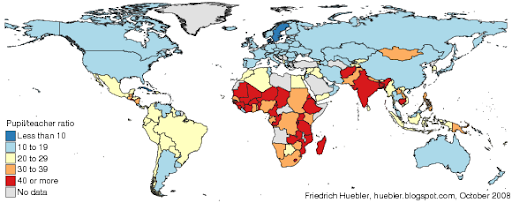
Pupil/teacher ratio in primary school, circa 2006
Map of the world showing national pupil/teacher ratios in primary school
Data source: UNESCO Institute for Statistics, Data Centre, May 2008.

The lowest pupil/teacher ratios in primary school were observed in Tokelau (5.8), San Marino (6.3), Bermuda (8.3), Liechtenstein (8.4), Denmark (9.9), and Sweden and Cuba (10.0). Most developed countries, countries in Eastern Europe and former members states of the Soviet Union have pupil/teacher ratios between 10 and 19. Some countries in East and South-East Asia, the Middle East, Africa, and Latin America also belong to this group, among them China, the world's most populous country, with a pupil/teacher ratio of 18.3. The majority of countries in Latin America, as well as some countries in Africa and Asia, have pupil/teacher ratios between 20 and 29.

Pupil/teacher ratios above 30 are common in Sub-Saharan Africa and South Asia. In 11 countries, primary school teachers have more than 50 pupils on average: Afghanistan (83.4), Mozambique (67.4), Rwanda (65.9), Chad (63.2), Mali (55.6), Congo (54.8), Burundi (54.2), Tanzania (53.1), Zambia (51.2), Bangladesh (50.9), and Cambodia (50.4). 22 of the 27 countries with 40 or more pupils per teacher are located in Sub-Saharan Africa.

The following table lists the average pupil/teacher ratio in primary school by Millennium Development Goal region. The highest pupil/teacher ratios exist in Sub-Saharan Africa (40.7) and Southern Asia (37.8). In contrast, the average pupil/teacher ratio in the developed countries is 13.7. In Western Asia (17.8), the Commonwealth of Independent States (17.9), and Oceania (19.8), the average pupil/teacher ratio is also below 20. The global average is 24.6 pupils per teacher in primary school. All regional and global averages are not weighted the population of each country; instead, each country is given the same weight within its region, regardless of the size of its population.

Pupil/teacher ratio in primary school by MDG region, circa 2006
MDG region
Pupil/teacher ratio
Developed countries 13.7
Commonwealth of Independent States 17.9
Eastern Asia 23.4
South-Eastern Asia 26.5
Oceania 19.8
Southern Asia 37.8
Western Asia 17.8
Northern Africa 24.4
Sub-Saharan Africa 40.7
Latin America and the Caribbean 21.3
World 24.6
Data source: UNESCO Institute for Statistics, Data Centre, May 2008. Regional and global averages are unweighted.

The data analyzed in this article can be downloaded from the UNESCO Institute for Statistics Data Centre, under Predefined Tables - Education - Table 11: Indicators on teaching staff at ISCED levels 0 to 3.

Related articles
External links
Friedrich Huebler, 26 October 2008 (edited 16 November 2006), Creative Commons License
Permanent URL: http://huebler.blogspot.com/2008/10/ptr.html

17 October 2008

UN Millennium Development Goals Report 2008

Cover of UN MDG Report 2008In August 2008, the United Nations published the latest edition of its annual report on progress toward the Millennium Development Goals (MDG). The Millennium Development Goals Report 2008 presents data for each of the eight MDGs.
  1. Eradicate extreme poverty and hunger
  2. Achieve universal primary education
  3. Promote gender equality and empower women
  4. Reduce child mortality
  5. Improve maternal health
  6. Combat HIV/AIDS, malaria and other diseases
  7. Ensure environmental sustainability
  8. Develop a global partnership for development
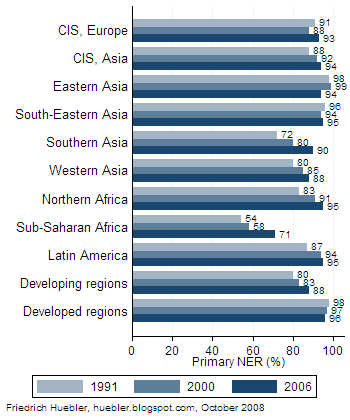
In the section on MDG 2, universal primary education, trends in primary school enrollment from 1991 to 2006 are shown for each MDG region. One region, the Commonwealth of Independent States, is further divided into countries in Europe and Asia. No data are provided for the Oceania region.

Primary school net enrollment rate, 1991-2006
Bar graph with regional primary school net enrollment rates from 1991 to 2006
Source: United Nations, The Millennium Development Goals Report 2008, page 12.

Six MDG regions have reached primary school net enrollment rates at or above 90 percent: Commonwealth of Independent States (Europe and Asia), Eastern Asia, South-Eastern Asia, Southern Asia, Northern Africa, and Latin America. Western Asia is slightly behind with a primary NER of 88 percent. In absolute terms, Sub-Saharan Africa has made the most progress since the turn of the millennium, with a 13 percent increase in the primary NER from 58 percent in 2000 to 71 percent in 2006. This increase was achieved in spite of strong growth in the population of primary school age. Still, three out of ten children of primary school age in Sub-Saharan Africa are not enrolled in primary school. In all developing regions combined, the primary NER rose from 80 percent in 1991 to 88 percent in 2006. In contrast, the primary NER in the developed regions declined from 98 percent in 1991 to 96 percent in 2006.

References
  • United Nations. 2008. The millennium development goals report 2008. New York: United Nations. (Download PDF document, 3.3 MB)
Related articles
External links
Friedrich Huebler, 17 October 2008, Creative Commons License
Permanent URL: http://huebler.blogspot.com/2008/10/mdg-report.html

12 October 2008

Education disparity in South Asia

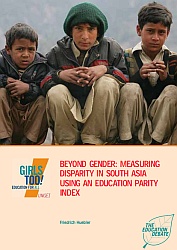
Cover of "Beyond gender: Measuring disparity in South Asia using an education parity index" by Friedrich HueblerA new publication by Friedrich Huebler describes education disparity in the countries of South Asia. The report Beyond gender: Measuring disparity in South Asia using an education parity index was published by the UNICEF regional office for South Asia in its series of papers on girls' education.

Analysis of disparities in national education systems is often limited to gender although other dimensions of disparity are also important. The publication presents data on disparity in primary and secondary education by gender, area of residence and household wealth for countries in South Asia.

To facilitate the interpretation of complex data a newly developed Education Parity Index is introduced. The EPI combines information on disparities across different education indicators and across different groups of disaggregation. This distinguishes the EPI from existing indicators of disparity in education, including the gender parity index and the EFA development index. The EPI is flexible and can be modified according to national priorities, for example by including information on disparities between different ethnic groups.

The use of the EPI as a tool to assess education disparities is illustrated with household survey data from Afghanistan, Bangladesh, India, Nepal and Pakistan. For each country, the report describes how the EPI is calculated. In addition, national trends in education disparity from 1996 to 2006 are presented.

References
  • Huebler, Friedrich. 2008. Beyond gender: Measuring disparity in South Asia using an education parity index. Kathmandu: UNICEF. (Download PDF document, 194 KB)
External links
Related articles
Friedrich Huebler, 12 October 2008 (edited 9 September 2012), Creative Commons License
Permanent URL: http://huebler.blogspot.com/2008/10/epi.html

05 October 2008

Child labor and school attendance

A previous article on child labor on this site presented a definition of child labor that considers both economic activity and household chores. The inclusion of household chores leads to a more precise measure of the burden of work on children. In particular, this new child labor indicator is less biased against girls, who typically spend more time on household chores and less time on economic activity than boys.

In the graph below, the proposed child labor indicator is used to evaluate the trade-off between child labor and school attendance among children aged 7 to 14 years in 35 developing countries. This age group was selected because in all 35 countries children are expected to enter primary school by age 7. The underlying data were collected with 26 Multiple Indicator Cluster Surveys (MICS) and 9 Demographic and Health Surveys (DHS) between 1999 and 2005. 34 of the surveys are nationally representative and one, Palestinians in Syria, is a subnational sample. Surveys conducted during school vacation were excluded from the analysis. The results therefore show the trade-off between child labor and school attendance during a time of the year when children are supposed to be in school.

School attendance refers to attendance of any type of school and not only schools that are part of the formal system of education. In addition, children of secondary school age who are still in primary school are also counted as attending school for the purpose of the present analysis. In contrast, such overage children are counted as out of school when indicators like the secondary school net attendance rate (NAR) are calculated. In a further simplification, child labor is defined for all ages as at least one hour of economic activity or 28 or more hours of household chores per week.

Child labor and school attendance, children 7-14 years
Scatter plot with child labor and school attendance rates in 35 countries
Data source: Demographic and Health Surveys (DHS), Multiple Indicator Cluster Surveys (MICS), 1999-2005.

The scatter plot above demonstrates the trade-off between child labor and school attendance. Countries with low child labor rates typically have high school attendance rates and vice versa. A linear regression shows that a 10 point increase in child labor is associated with a 7.6 point decrease in school attendance at the national level.

On average across the 35 countries in the sample, 77 percent of 7- to 14-year-olds attended school at the time of they survey. In ten countries, at least 90 percent of children were in school. In seven countries - Central African Republic, Chad, Guinea-Bissau, Mali, Niger, Sierra Leone, and Somalia - less than half of all children went to school. Somalia has by far the lowest attendance rate with 19 percent.

25 percent of all children between 7 and 14 years were engaged in child labor, ranging from 4 percent among Palestinians in Syria to 78 percent in Niger and Sierra Leone. In six countries, more than half of all children in this age group were child laborers: Central African Republic, Chad, Guinea-Bissau, Niger, Sierra Leone, and Uganda.

Related articlesExternal links
Friedrich Huebler, 5 October 2008, Creative Commons License
Permanent URL: http://huebler.blogspot.com/2008/10/child-labor.html

07 September 2008

Child labor: economic activity and household chores

Child labor is one of the obstacles on the way to the Millennium Development Goal of universal primary education by 2015. In a report on global child labor trends, the International Labour Organization (ILO) estimates that there are 218 million child laborers worldwide. 126 million of these children are estimated to be engaged in hazardous work (ILO 2006). The concept of child labor used by the ILO is derived from two conventions: ILO Convention 138, which sets 15 years as the general minimum age for employment, and ILO Convention 182 on the worst forms of child labor. Any work in violation of Conventions 138 and 182 is considered illegal child labor that should be eliminated.

One limitation of statistics like those published by the ILO is that they only refer to economic activity, that is work related to the production of goods and services, as defined in the United Nations System of National Accounts (UNSD 2001). This definition excludes chores undertaken in a person's own household like cooking, cleaning or caring for children.

Statistics of child labor that ignore household chores are problematic because they underestimate the burden of work on children, especially for girls. To examine the relative burden of economic activities and household chores carried out by children, data from 35 household surveys were analyzed for this article. Grouped by Millennium Development Region, these surveys are:
  • Developed countries: Albania.
  • Eastern Asia: Mongolia.
  • South-eastern Asia: Lao PDR, Philippines.
  • Southern Asia: India.
  • Western Asia: Bahrain, Lebanon, Palestinians in Syria.
  • Sub-Saharan Africa: Angola, Burundi, Central African Republic, Chad, Comoros, Congo, Côte d'Ivoire, Democratic Republic of the Congo, Gambia, Guinea, Guinea-Bissau, Kenya, Lesotho, Malawi, Mali, Niger, Senegal, Sierra Leone, Somalia, Swaziland, Tanzania, Uganda.
  • Latin America and the Caribbean: Bolivia, Colombia, Dominican Republic, Nicaragua, Trinidad and Tobago.
The surveys were conducted between 1999 and 2005. 26 of the surveys were Multiple Indicator Cluster Surveys (MICS) and 9 were Demographic and Health Surveys (DHS). All 35 surveys collected data on work by children in the week preceding the survey. Surveys conducted during school vacation were excluded because the focus of the present analysis is work by children that should have been in school at the time of the survey.

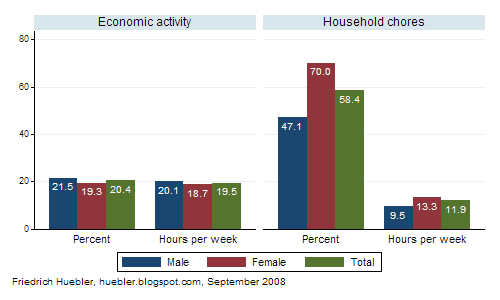
The share of children aged 7 to 14 years in economic activity and household chores is depicted in the following graph. The graph also displays the number of hours spent per week on both types of work. All numbers are averages across the 35 surveys, weighted by each country's population between 7 and 14 years.

Economic activity and household chores, children 7-14 years
Graph showing the link between household wealth and average years of education
Data source: 35 DHS and MICS surveys, 1999-2005.

The results confirm that boys are more likely to be engaged in economic activity while girls are more likely to do household chores. On average across the 35 surveys, 22 percent of all boys and 19 percent of all girls between 7 and 14 years are engaged in economic activity. Boys also spend more hours on economic activity than girls, 20 compared to 19 hours. By comparison, girls are much more likely than boys to do household chores. 70 percent of all girls and 47 percent of all boys did household chores in the week preceding the survey. On average, girls spent 13 hours and boys 10 hours per week on household chores.

What are the implications of these findings for statistics of child labor, as currently defined by the ILO? Take the case of two families that need additional income to provide food for everyone in the household. In the first family, a 10-year-old boy is withdrawn from school and put to work on a farm. Because such work is considered economic activity the number of child laborers goes up. In the second family, the mother decides to start working on a farm and her 10-year-old daughter is asked to stay at home to care for her younger siblings. Because the girl is engaged in household chores the number of child laborers does not change. The consequences are the same for both children: they no longer go to school and miss out on the benefits from education.

To address the limitations of the ILO's definition of child labor, UNICEF has developed an expanded definition that covers household chores in addition to economic activity. This revised indicator is the basis for the child labor estimates that are reported in publications like Progress for Children (UNICEF 2007a) or The State of the World’s Children (UNICEF 2007b). For children 5 to 17 years of age, UNICEF defines child labor as follows:
  • 5 to 11 years: any economic activity, or 28 hours or more household chores per week;
  • 12 to 14 years: any economic activity (except light work for less than 14 hours per week), or 28 hours or more household chores per week;
  • 15 to 17 years: any hazardous work, including any work for 43 hours or more per week.
The goal of UNICEF's child labor indicator is the measurement of work that should be eliminated because it violates international child labor conventions and interferes with school attendance. The threshold for household chores is set relatively high because it is assumed that household chores are less harmful than economic activity. Moreover, the high threshold of 28 hours household chores per week avoids a possible overestimation of the number of child laborers.

References
  • International Labour Organization (ILO). 2006. Global child labour trends 2000-2004. Geneva: ILO. (Download PDF, 640 KB)
  • United Nations Children's Fund (UNICEF). 2007a. Progress for children: A World Fit for Children statistical review. New York: UNICEF. (Download PDF, 3.6 MB)
  • United Nations Children's Fund (UNICEF). 2007b. The state of the world's children 2008: Child survival. New York: UNICEF. (Download PDF, 4.3 MB)
  • United Nations Statistics Division (UNSD). 2001. System of national accounts 1993. http://unstats.un.org/unsd/sna1993/toctop.asp.
Related articles
External links
Friedrich Huebler, 7 September 2008 (edited 5 October 2008), Creative Commons License
Permanent URL: http://huebler.blogspot.com/2008/09/child-labor.html