27 February 2007

Global trends in primary and secondary education, 2000-2004
How close is the world to the Millennium Development Goal of universal primary education by 2015? This article looks at the trends in four indicators of primary and secondary education.
  • Primary net intake rate (NIR), the share of children who enter school at the official school entrance age. Calculation method: Primary NIR = number of new entrants to the first grade of primary school who are of official primary school entrance age / total number of children of official primary school entrance age.
  • Primary net enrollment rate (NER), the share of children of official primary school age who are enrolled in primary school. Calculation method: Primary NER = number of children of official primary school age who are enrolled in primary school / total number of children of official primary school age.
  • Secondary net enrollment rate (NER), the share of children of official secondary school age who are enrolled in secondary school. Calculation method: Secondary NER = number of children of official secondary school age who are enrolled in secondary school / total number of children of official secondary school age.
  • Survival rate to grade 5: The share of children enrolled in the first grade of primary school who eventually reach the fifth grade, regardless of grade repetition. Calculation method: Survival rate to grade 5 = number of children reaching grade 5 / number of children enrolled in grade 1.
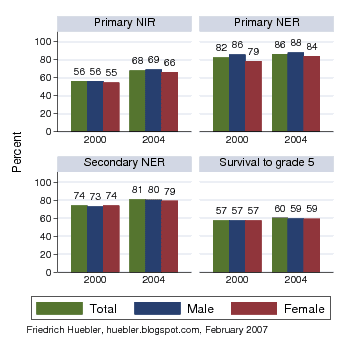
The graph and table below show how these four indicators have evolved worldwide between 2000 and 2004, the year with the most recent data on enrollment. Global values were calculated from national data obtained from UNESCO's education database. The theoretical range of all four indicators is 0 to 100 percent.

Global trends in primary and secondary education, 2000-2004
Bar graph with trends in education statistics, 2000-2004
Data source: UNESCO global education database, October 2006. - Note: Male and female survival rates are available for fewer countries than the total survival rate.

The biggest increases were observed for the primary net intake rate and the secondary net enrollment rate. The primary net intake rate increased from 56.3 to 67.8 percent, but fewer girls than boys enroll in school at the official school age. For boys, the primary net intake rate in 2004 is 68.9 percent, compared to 66.4 percent for girls. The secondary net enrollment rate grew from 73.7 to 80.7 percent. As with the net intake rate, the increase for boys exceeded that for girls but the disparity between boys' and girls' secondary enrollment rates is only 1.2 percent.

Among the indicators listed here, the primary school net enrollment rate has the highest values. Between 2000 and 2004, the primary NER increased from 82.5 to 86.4 percent. Possibly due to increased efforts to enroll girls in school, the primary NER of girls grew by 5.6 percentage points over the four-year period, compared to 2.5 percentage points for boys. As a result, the gap between the male and female primary NER fell from 7 percent in 2000 to 4 percent in 2004.

The survival rate to grade 5 showed the smallest improvement between 2000 and 2004. For all children combined, this indicator grew from 57.4 to 60.1 percent. In contrast to the other three indicators, there is no gender disparity in the survival rate to grade 5. Both boys and girls have the same probability of advancing to the fifth grade. (Note that gender disaggregated values are available for a smaller number of countries than the total survival rate. This explains why both the male and female survival rate are below the total survival rate. If data on the survival rate to grade 5 were available for all countries, the total value would lie between the male and female values.)

Global trends in primary and secondary education, 2000-2004
Indicator20002004Change 2000-2004
Primary net intake rate (%), total56.367.811.6
Primary net intake rate (%), male56.268.912.7
Primary net intake rate (%), female54.566.411.9
Primary net enrollment rate (%), total82.586.43.9
Primary net enrollment rate (%), male85.688.12.5
Primary net enrollment rate (%), female78.684.15.6
Secondary net enrollment rate (%), total73.780.77.0
Secondary net enrollment rate (%), male72.580.27.6
Secondary net enrollment rate (%), female73.679.05.4
Survival rate to grade 5 (%), total57.460.12.7
Survival rate to grade 5 (%), male57.359.21.9
Survival rate to grade 5 (%), female57.159.12.0
Data source: UNESCO global education database, October 2006. - Note: Male and female survival rates are available for fewer countries than the total survival rate.

Edit 10 March 2007: Some countries were added to the calculations and as a result the global values changed.

Related articles
External links
Friedrich Huebler, 27 February 2007 (edited 10 March 2007), Creative Commons License
Permanent URL: http://huebler.blogspot.com/2007/02/global-trends-in-primary-and-secondary.html

27 January 2007

Official school ages: primary, secondary, and compulsory education

Some of the statistics on this site, for example primary and secondary school net enrollment rates, are easier to interpret if the official school ages in a country are known. I have therefore prepared a file that lists the official school ages in 206 countries and territories, taken from the latest release of UNESCO's global education database. This article summarizes the entrance age and duration of primary, secondary, and compulsory education from that database. To download the file with official school ages go to the bottom of this article.

In 204 of 206 countries, children enter primary school between 5 and 7 years of age (see Table 1). Exceptions are Ireland, where primary school begins at 4 years, and Mongolia, where it begins at 8 years. In 127 countries, the official primary school entrance age is 6 years. The duration of primary school ranges from 3 years (in Armenia, Russia, and Turkmenistan) to 8 years (in Ireland). In 123 countries, primary school has 6 grades.

Table 1: Entrance age and duration of primary education
   Primary |
    school |           Primary school          |
  duration |        entrance age (years)       |
   (years) |     4      5      6      7      8 | Total
-----------+-----------------------------------+------
         3 |     0      0      0      3      0 |     3
         4 |     0      0     12     16      1 |    29
         5 |     0      4     17      3      0 |    24
         6 |     0     15     86     22      0 |   123
         7 |     0     11     12      3      0 |    26
         8 |     1      0      0      0      0 |     1
-----------+-----------------------------------+------
     Total |     1     30    127     47      1 |   206


The official entrance age for secondary school ranges from 10 to 14 years (see Table 2). In 102 of 206 countries and territories, children enter secondary school at 12 years of age. The duration of secondary school ranges from 4 years (in Gibraltar and the Philippines) to 9 years (in Germany and Slovakia).

Table 2: Entrance age and duration of secondary education
 Secondary |
    school |         Secondary school          |
  duration |       entrance age (years)        |
   (years) |    10     11     12     13     14 | Total
-----------+-----------------------------------+------
         4 |     0      1      1      0      0 |     2
         5 |     0      2     25     11      2 |    40
         6 |     2      8     55     16      1 |    82
         7 |     9     24     21      7      0 |    61
         8 |     6     13      0      0      0 |    19
         9 |     2      0      0      0      0 |     2
-----------+-----------------------------------+------
     Total |    19     48    102     34      3 |   206


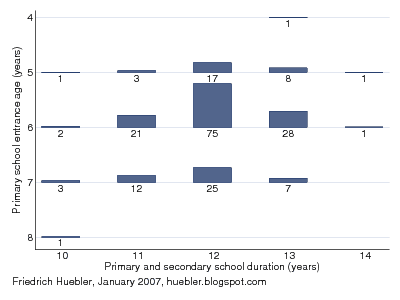
Children who complete both primary and secondary education have to attend school for 10 to 14 years (see Table 3 and Figure 1). In seven countries, children can continue their education at a higher level after 10 years of primary and secondary school (Armenia, Gibraltar, Mongolia, North Korea, Philippines, Russia, and Turkmenistan). In two countries, the completion of primary and secondary school combined takes 14 years (Cook Islands and Iceland). In more than half of all countries, primary and secondary school combined take 12 years.

Table 3: Entrance age and duration of primary and secondary education
   Primary |
       and |
 secondary |
    school |           Primary school          |
  duration |        entrance age (years)       |
   (years) |     4      5      6      7      8 | Total
-----------+-----------------------------------+------
        10 |     0      1      2      3      1 |     7
        11 |     0      3     21     12      0 |    36
        12 |     0     17     75     25      0 |   117
        13 |     1      8     28      7      0 |    44
        14 |     0      1      1      0      0 |     2
-----------+-----------------------------------+------
     Total |     1     30    127     47      1 |   206


Figure 1: Entrance age and duration of primary and secondary education
Graph with distribution of entrance age and duration of primary and secondary school
Data source: UNESCO global education database, October 2006. - Number below bar indicates countries in group.

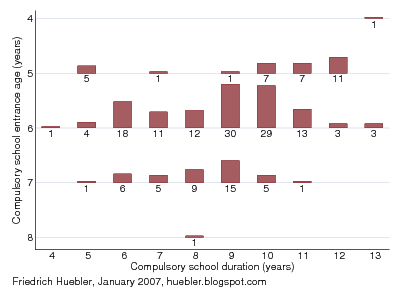
The length of compulsory education has a wider range than primary and secondary education combined (see Table 4 and Figure 2). Children can enter school between 4 and 8 years and graduate after 4 to 13 years to comply with national regulations of school attendance. In some countries only primary education is required, while in other countries children have to continue their education at the secondary level. One country requires only 4 years of schooling (Angola), and ten more countries require 5 years of schooling (Anguilla, Bangladesh, Brunei, Equatorial Guinea, Iran, Laos, Myanmar, Nepal, Pakistan, and Samoa). At the upper end are four countries with 13 years of compulsory education (Belgium, Germany, Netherlands, and Turks and Caicos Islands). On average, compulsory education takes 8 to 9 years.

Table 4: Entrance age and duration of compulsory education
Compulsory |
    school |         Compulsory school         |
  duration |        entrance age (years)       |
   (years) |     4      5      6      7      8 | Total
-----------+-----------------------------------+------
         4 |     0      0      1      0      0 |     1
         5 |     0      5      4      1      0 |    10
         6 |     0      0     18      6      0 |    24
         7 |     0      1     11      5      0 |    17
         8 |     0      0     12      9      1 |    22
         9 |     0      1     30     15      0 |    46
        10 |     0      7     29      5      0 |    41
        11 |     0      7     13      1      0 |    21
        12 |     0     11      3      0      0 |    14
        13 |     1      0      3      0      0 |     4
-----------+-----------------------------------+------
     Total |     1     32    124     42      1 |   200


Figure 2: Entrance age and duration of compulsory education
Graph with distribution of entrance age and duration of compulsory education
Data source: UNESCO global education database, October 2006. - Number below bar indicates countries in group.

Download
The ZIP archive contains three files with the official primary, secondary, and compulsory school ages. One file is in Excel format, one in Stata format, and one in tab-delimited text format. The contents of the three files is identical and the following variables are included:
  • country: country name
  • primage: official entrance age of primary education
  • primdur: official duration of primary education
  • secage: official entrance age of secondary education
  • secdur: official duration of secondary education
  • compage: official entrance age of compulsory education
  • compdur: official duration of compulsory education
Related articles
External links
Friedrich Huebler, 27 January 2007 (edited 1 July 2012), Creative Commons License
Permanent URL: http://huebler.blogspot.com/2007/01/official-school-ages-primary-secondary.html

01 January 2007

New blog feature: Subject labels

All articles on my blog on education statistics are now labeled with keywords. This feature was introduced with a new version of Blogger, launched on 19 December 2006. Clicking on a label leads to a page containing all posts with the particular label (example: all posts labeled "India"). In addition, I continue to use del.icio.us tags for all posts on the blog, as described in my article on blog categories. I also added the backlinks feature of Blogger that provides a list of links to an article.

Links:
Friedrich Huebler, 1 January 2007 (edited 27 January 2007), Creative Commons License
Permanent URL: http://huebler.blogspot.com/2007/01/new-blog-feature-subject-labels.html

24 December 2006

"The State of the World's Children 2007" by UNICEF: Gender disparity in primary and secondary school

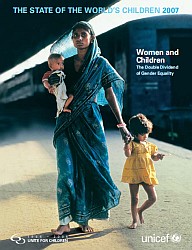
Cover of The State of the World's Children 2007 by UNICEFOn 11 December 2006, UNICEF released the 2007 edition of its annual publication The State of the World's Children. This year's report, with the title Women and children: The double dividend of gender equality, looks at the status of women today and discusses how gender equality can help achieve the UN Millennium Development Goals.
The report argues that gender equality produces a double dividend because it benefits both women and children. Healthy, educated and empowered women have healthy, educated and confident children. Through gender equality women can not only live full and productive lives, they can also improve the lives of their children, their families, and the society they are part of.

The State of the World's Children contains detailed statistical tables with data on health, nutrition, HIV/AIDS, education, demographics, economy, women, and child protection for each country. In the area of education, the report lists data for the following indicators:
  • Literacy
  • Primary school enrollment and attendance
  • Secondary school enrollment and attendance
  • Survival rate to grade 5
Data on primary and secondary school enrollment shows that gender disparity continues to exist in most regions of the world. The graph below compares female and male enrollment rates by expressing the female gross enrollment rate (GER) as a percentage of the male GER. The primary school GER is calculated as follows:
  • Primary school gross enrollment rate (GER) = Number of children enrolled in primary school / Number of children of official primary school age
By definition, the GER can exceed 100 percent. This can be the case in countries where many children enter school late or where many children repeat a grade. However, the GER is frequently used to assess a country's education system because it measures the participation of all children, not only those of official primary or secondary school age (see primary school gross and net enrollment). The GER ratio is calculated as follows:
  • Female GER as a percent of male GER = 100 * (Female GER / Male GER)
A value of 100 percent means that the enrollment rates of girls and boys are at the same level and that gender parity has been reached. If the ratio is below 100 percent, fewer girls than boys are in school. If the ratio is above 100 percent, more girls than boys are in school. The ratio of female to male enrollment rates is also known as the gender parity index.

Note that the reported values contain no information about the absolute level of school enrollment. It is possible to have gender parity at very low enrollment levels. Take a country where 50 percent of boys and 50 percent of girls attend primary school. Although the country would be far from the Millennium Development Goal of universal primary education, there would be gender parity in primary school. For data on absolute enrollment levels refer to an earlier post on primary school enrollment in 2004, with the most recent data from the UNESCO Institute for Statistics.

Primary and secondary school gross enrollment ratios: female GER as a percent of male GER, 2000-2005
Bar graph with female gross enrolment ratios as a percentage of male gross enrolment ratios, 2000-2005
Data source: UNICEF. 2006. The state of the world's children 2007: Women and children - The double dividend of gender equality. New York: UNICEF. Table 8, page 133.

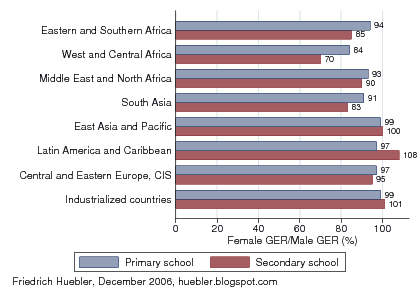
According to the data reported by UNICEF, only two regions have achieved gender parity in both primary and secondary school: East Asia and the Pacific, and the industrialized countries. The countries of Central and Eastern Europe and the Commonwealth of Independent States (CIS) are close to gender parity, with female enrollment rates at 95 to 97 percent of male enrollment rates. Latin America and the Caribbean are close to gender parity in primary school but in secondary school, the female GER far exceeds the male GER (gender parity index 108 percent), which means that more girls than boys continue their education past primary school.

In the Middle East and North Africa, the female GER is at 93 percent of the male GER in primary school and at 90 percent in secondary school. In the three remaining regions, there is a larger drop in the gender parity index from primary to secondary school. In Eastern and Southern Africa, almost as many girls as boys are enrolled in primary school (gender parity index 94 percent) but at the secondary level of education, the female GER is only 85 percent of the male GER. In South Asia, the gender parity index is 91 percent in primary school and 83 percent in secondary school.

In West and Central Africa, girls are furthest behind boys in terms of school enrollment. The gender parity index is 84 percent in primary school and 70 percent in secondary school. In addition, total enrollment rates are lower than in any other region of the world (see primary school enrollment in 2004 and primary school enrollment in 2002/03). Compared to boys and compared to girls in other region, girls from West and Central Africa are least likely to reap the benefits of a formal school education.

External links
Related articles
Friedrich Huebler, 24 December 2006, Creative Commons License
Permanent URL: http://huebler.blogspot.com/2006/12/state-of-worlds-children-2007-by-unicef.html

07 December 2006

Years of schooling and literacy, part 2

The Education for All Global Monitoring Report 2007 assesses individual countries' progress toward the goal of basic education for all children and adults by 2015 with the EFA Development Index (EDI). One component of the EDI is the adult literacy rate. In countries where the adult literacy rate is not available, the EDI is calculated with a proxy measure: the share of the adult population with at least a complete primary education (UNESCO 2006, p. 201, note 2).

A previous article on this site, "Years of schooling and literacy: Can everyone with primary education read and write?", analyzed data on years of schooling and literacy from 26 household surveys in Sub-Saharan Africa. The results showed that most persons who graduated from primary school or attended higher levels of education can indeed be considered literate and that the share of the adult population with at least a complete primary education is therefore a suitable proxy for the adult literacy rate.

The present article extends the analysis from Sub-Saharan Africa to 19 additional countries from Latin America, North Africa, Asia, and Eastern Europe. The data, collected between 1998 and 2004, is from 15 Multiple Indicator Cluster Surveys (MICS) funded by UNICEF, and 4 Demographic and Health Surveys (DHS) funded by the United States Agency for International Development (USAID). The surveys and data collection methods are described in detail in the previous article with literacy data from Sub-Saharan Africa.

For the analysis that follows, household members in each survey dataset were divided into 13 groups according to the highest grade of formal education completed: no formal education, grade 1 completed, grade 2 completed, ..., grade 11 completed, and grade 12 or higher completed. Within each group, the share of literate persons was calculated. The results are plotted in the graphs below.

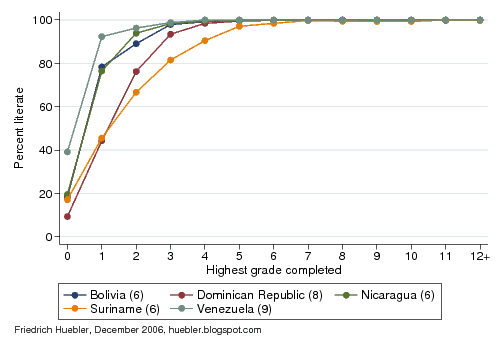
For the presentation of the results, countries are grouped according to the geographic regions used by UNICEF. The first graph shows data from 5 countries in Latin America and the Caribbean. For each country, a line indicates how the percentage of literate persons varies with the completed years of formal education. In Suriname, for example (the orange line in the graph), 17 percent of all persons without formal education are literate, compared to 46 percent of those who completed the first grade, 67 percent of those who completed the second grade, and so on. The number in parentheses behind the name of each country indicates the official length of primary education in years. For example, primary school has six grades in Bolivia and eight grades in the Dominican Republic.

The available data for Latin American and the Caribbean shows that the education systems in this region perform very well in terms of literacy. Literacy rates increase steadily with increasing years of education and by the time children complete primary school, close to 100 percent can read and write.

Years of education and literacy in Latin America and the Caribbean
Line graph showing link between years of eduation and literacy rate in Latin America and the Caribbean
Data source: 3 DHS and 2 MICS surveys, 1999-2004. - Number after country name indicates official duration of primary education.

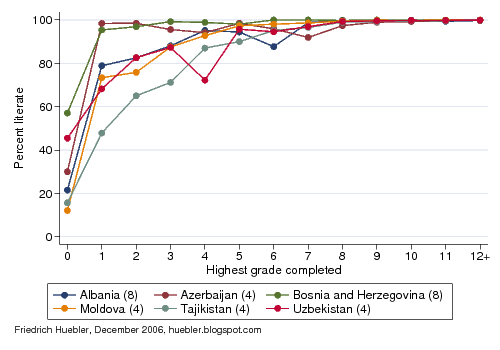
The second graphs shows data from 6 countries in Central and Eastern Europe and the Commonwealth of Independent States. In contrast to Latin America and the Caribbean, completion of primary school does not guarantee literacy. In Tajikistan, only 87 percent of those with complete primary education can be considered literate. In Azerbaijan and Moldova, literacy rates are 93 to 94 percent after graduation from the last grade of primary school. The low literacy rate among persons with four years of education in Uzbekistan is an outlier caused by a skewed age distribution. This group includes a high share of persons above 60 years of age who left school after completing primary school and who have relatively low literacy levels compared to other groups. In all countries literacy levels are near 100 percent once a person has 8 or more years of education.

Years of education and literacy in Central and Eastern Europe and the Commonwealth of Independent States
Line graph showing link between years of eduation and literacy rate in Central and Eastern Europe and the Commonwealth of Independent States
Data source: 6 MICS surveys, 2000. - Number after country name indicates official duration of primary education.

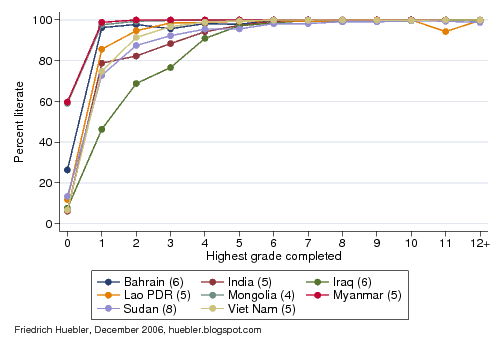
The last graph combines 8 countries from 3 UNICEF regions: the Middle East and North Africa, South Asia, and East Asia. The results are similar to those for Latin America and the Caribbean. Virtually all children who graduate from primary school can read and write. Even in Iraq, the country with the slowest increase in literacy rates according to the highest grade completed, 99 percent of primary school graduates could read and write (the data for Iraq was collected in 2000, before the current war).

Years of education and literacy in East Asia, South Asia, and the Middle East and North Africa
Line graph showing link between years of eduation and literacy rate in East Asia, South Asia, and the Middle East and North Africa
Data source: 1 DHS and 7 MICS surveys, 1998-2003. - Number after country name indicates official duration of primary education.

To summarize, in most countries completion of primary school provides students with the necessary reading and writing skills. There are exceptions, especially in some former states of the Soviet Union (see above) and in parts of West and Central Africa (see the previous article), where additional years of education are needed to guarantee literacy. In spite of these limitations, the share of the population with at least a complete primary education can be considered a good indicator for the adult literacy rate.

References
  • UNESCO. 2006. Education for All Global Monitoring Report 2007: Strong foundations - Early childhood care and education. Paris: UNESCO.
Related articlesExternal links
Friedrich Huebler, 7 December 2006, Creative Commons License
Permanent URL: http://huebler.blogspot.com/2006/12/years-of-schooling-and-literacy-part-2.html