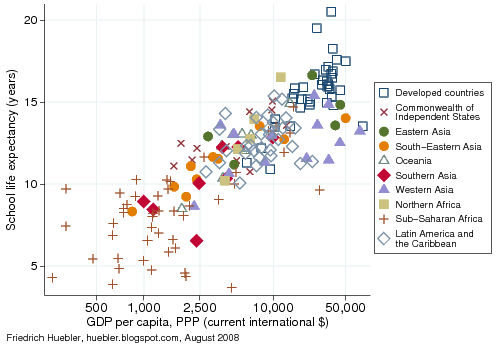
A similar link can be observed at the level of individual households. Households whose members have a higher level of education are usually wealthier than households with less educated members. The relationship between household wealth and education can be analyzed with data from household surveys. This article looks at data from 12 nationally representative household surveys that were conducted between 2004 and 2006 in Bangladesh, Cambodia, Colombia, Egypt, Ethiopia, Haiti, India, Moldova, Nepal, Niger, Sierra Leone, and Zimbabwe. The data from Bangladesh and Sierra Leone is from Multiple Indicator Cluster Surveys (MICS) and the data from the other countries was collected with Demographic and Health Surveys (DHS).
DHS and MICS surveys collect data on assets owned by a household - for example, water supply and sanitation facilities, housing material, radio, telephone, refrigerator, bicycle, automobile, and livestock - that can be used to construct an index of household wealth (Filmer and Pritchett 2001). With this index it is possible to rank the households in a survey from poorest to richest. The households can then be divided into wealth deciles, each containing 10 percent of the sample population.
DHS and MICS surveys also collect data on the education of all household members above a certain age, usually 5 to 7 years. For the analysis in this article, the years of formal education of all household members aged 20 to 65 years were examined. For example, a person that did not complete primary school may have 3 years of education while someone with a university degree may have 16 years of education. In the next step, the average number of years of education within each wealth decile is calculated.
The data on household wealth and years of education is plotted in the graph below. Wealth deciles are plotted along the horizontal axis. The average number of years of education of persons aged 20 to 65 years in each wealth decile is plotted along the vertical axis. As an example, in Bangladesh, persons in the poorest decile have 1.3 years of education on average and persons in the richest decile have 10.1 years of education.
Household wealth and years of education

Data source: Demographic and Health Surveys (DHS), Multiple Indicator Cluster Surveys (MICS), 2004-2006.
The graph shows that an increase in the average years of education of all adult household members is correlated with an increase in household wealth. This relationship is true without exception in all 12 countries that were analyzed. Persons in higher wealth deciles always have more years of education than persons in lower deciles.
The graph also shows that the disparity between poorer and richer households in terms of education varies from country to country. In Moldova, almost everyone attends primary and secondary school and even in the poorest decile the average number of years of education is 9.3, compared to 13.6 years of education in the richest decile. In Zimbabwe, most persons attended at least primary school; persons in the poorest decile have 5.4 years of education on average and persons in the richest decile 11.4 years.
In contrast, Niger is a country where few persons between 20 and 65 years of age attended school. 80 percent of the population have less than 1 year of education. The average number of years of education is 0.3 in the poorest decile, 0.9 in the eighth decile, 1.8 in the ninth decile, and 5.3 in the richest decile. In Ethiopia, 80 percent of the adult population have fewer than 2 years of education and in Sierra Leone, 70 percent have fewer than 2 years of education. Cambodia and Nepal are also countries where a large part of the population has relatively little formal education.
In other countries, the increase in the number of years of education from poorer to richer deciles is more pronounced. In Egypt, persons in the poorest decile have 3.1 years of education on average and those in the richest decile have 13.8 years of education. In India, the average number of years of education is 1.4 in the poorest decile and 11.9 in the richest decile. In Haiti, the respective numbers are 1.2 and 10.7 years of education. In Colombia, the average number of years of education ranges from 3.6 in the poorest decile to 12.5 in the richest decile.
The positive link between wealth and years of education at the household level can be explained similarly to the link between these two variables at the national level. Persons with a higher level of education can earn more than those with less education. At the same time, members of wealthier households can afford education more easily than members of poorer households. At the extreme end, very poor families may not only lack the financial resources to send their children to school, they may also have to rely on the income from child labor to guarantee the survival of everyone in the household. This relationship between household wealth and child labor was analyzed in two articles on child labor and school attendance in Bolivia.
Reference
- Filmer, Deon, and Lant H. Pritchett. 2001. Estimating wealth effects without expenditure data - or Tears: An application to educational enrollments in states of India. Demography 38 (1), February: 115-132.
- National wealth and years of education
- National wealth and school enrollment
- Poverty and educational attainment in the United States
- Poverty and educational attainment in the United States, part 2
- Child labor and school attendance in Bolivia
- Child labor and school attendance in Bolivia, part 2
Friedrich Huebler, 24 August 2008, Creative Commons License
Permanent URL: http://huebler.blogspot.com/2008/08/hh-wealth.html
